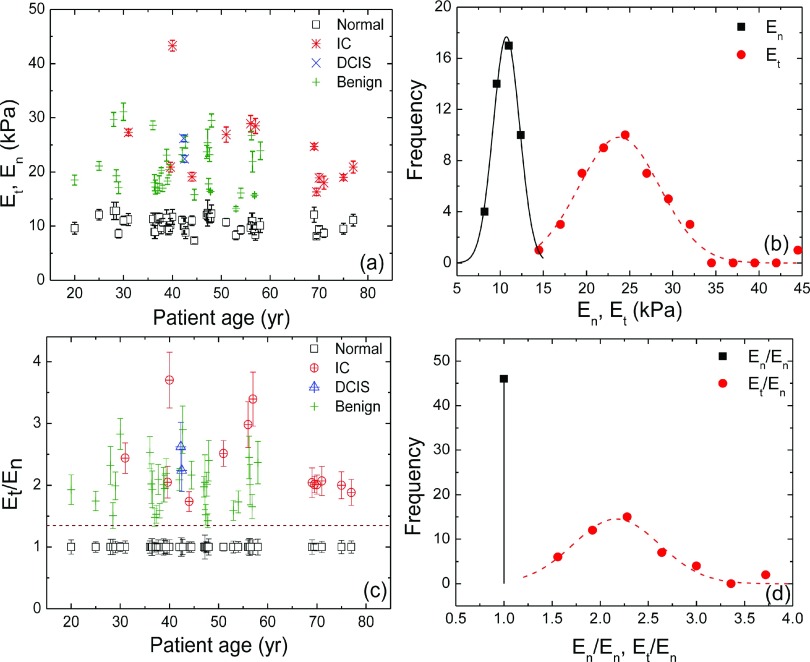
FIG. 8.
(a) Et, En versus age of 40 patients, (b) distributions of Et (red) and En (black) as obtained from (a), (c) Et/En and En/En versus age, and (d) distribution of Et/En and En/En, where En stands for the elastic moduli of normal breast tissues (□) and Et is the maximum elastic moduli in the tumor regions: benign tumor (+), DICS (×), and IC (*) and the solid and dashed bell-shaped curves in (b) represent the Gaussian fits to the distributions of En and Et, respectively and the dashed bell-shaped curve in (d) represents the Gaussian fit to the distribution of Et/En.

