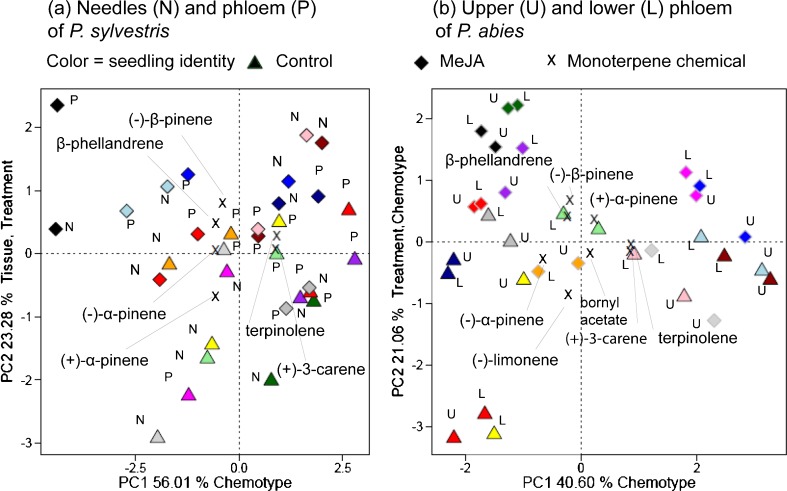
Fig. 6.
Principal component analysis (PCA) score plots of relative amounts of monoterpenes in sets of eight control and methyl jasmonate (MeJA)-treated a Pinus sylvestris and b Picea abies seedlings. Data for individual seedlings are color-coded (color version of the figure is available online), and include contents in needles and phloem tissues of P. sylvestris, and phloem tissues (upper and lower) of P. abies. Triangles (▲) and diamonds (◆) indicate tissues from control and MeJA-treated seedlings, respectively. Error bars denote SE, and percentages denote percentages of variance explained

