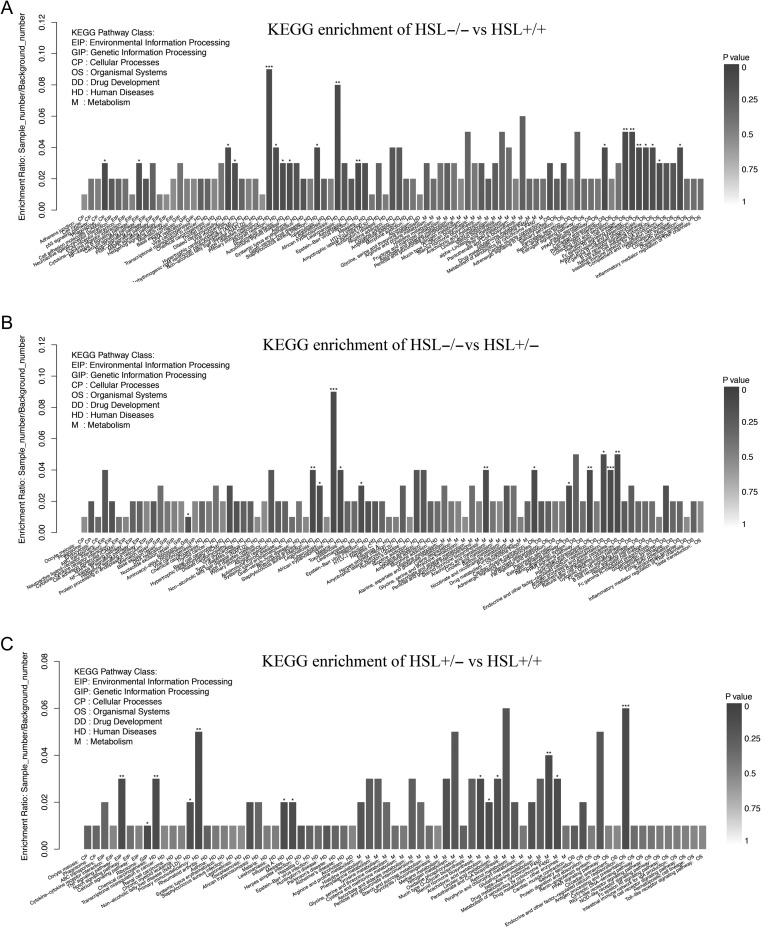
Figure 4.
KEGG enrichment of DEGs among HSL−/−, HSL+/− and HSL+/+ testes. The transcripts were matched with the KEGG database. KEGG enrichment of DEGs between (A) HSL−/− and HSL+/+, (B) HSL−/− and HSL+/− and (C) HSL−/+ and HSL+/+. Each column is a pathway. The horizontal axis shows the process name and classification, color indicates statistical significance, and the color intensity indicates the degree of significance. Significance analysis by KOBAS. P < 0.01; ***P < 0.001; **P < 0.01; *P < 0.05.

 This work is licensed under a