Fig. 3.

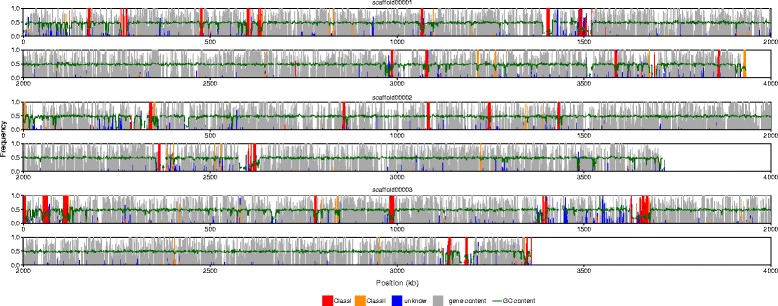
Overview of the gene content (gray), repeat content and the average GC content (green line) in selected scaffolds. The vertical lines (bars) represent the fraction of bases covered by genes and repeats within consecutive 1 kb windows

Overview of the gene content (gray), repeat content and the average GC content (green line) in selected scaffolds. The vertical lines (bars) represent the fraction of bases covered by genes and repeats within consecutive 1 kb windows