
Fig. 1.
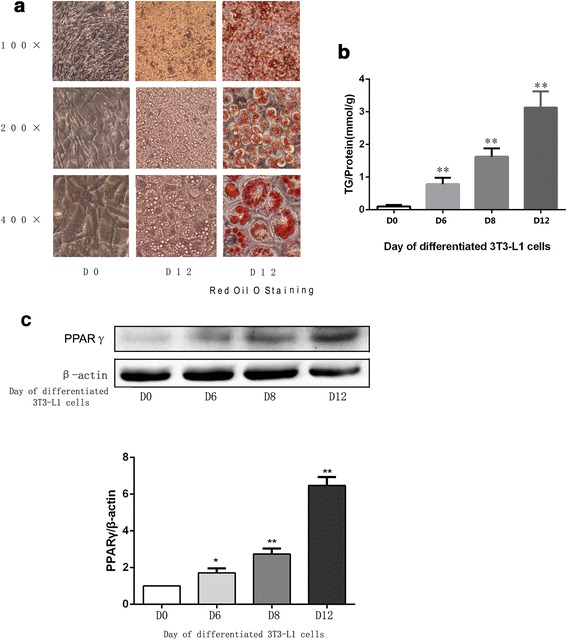
a Representative images of 3T3-L1 cells on D0 and D12 during the differentiated process and Oil red O staining of differentiated 3T3-L1 cells on D12. b TG content assay of 3T3-L1 cells on different day in the differentiated process. Intracellular TG contents were normalized by total protein. c 3T3-L1 cells were induced to differentiated adipocytes according to the protocol. Proteins in the cells of different days on the differentiated process were separated by SDS-PAGE and immunoblotted for PPARγand β-actin. Representative Western blot results are shown. The data were presented as the mean ± SD. * p <0.05, **p <0.01 versus the group of D0