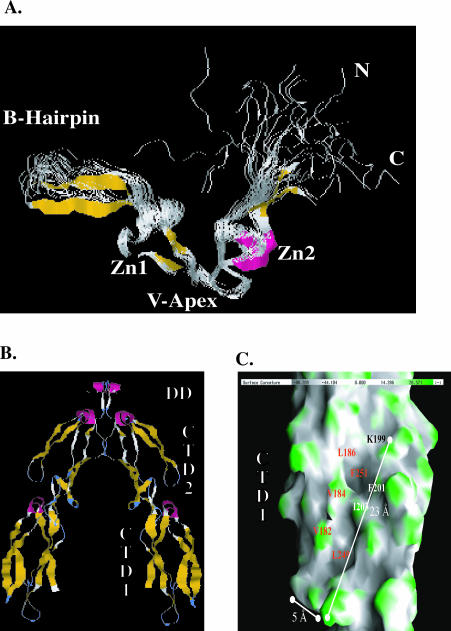
Fig 4.
Structure of regions in type I and type II Hsp40s that are involved in chaperone function. (A) The nuclear magnetic resonance solution structure of the zinc finger–like region (ZFLR) from E coli DnaJ. A ribbon diagram depicting the nuclear magnetic resonance solution structure of a protein fragment that corresponds to Gly131 to Ser209 of E coli DnaJ. This image was rendered from PDB file 1EXK. β-Strands are shown in gold, and α-helices are in pink. Zn1 and Zn2 denote the 2 regions in the ZFLR where zinc is bound. N and C denote the position of resides 8 and 79 of DnaJ 131–209. This diagram represents 20 structures. (B) Ribbon diagram of the Sis1 (171–352) dimer. Sis1 (171–352) is truncated at the end of the glycine- and methionine-rich region (G/M) region, and this model shows residues 180–352. A and B represent the monomers that form the Sis1 (171–352) dimer, which has a 2-fold axis. Subdomains present in the Sis1 (171–352) monomer are labeled. Carboxyl-terminal domain I (CTDI) corresponds to residues 180–254. CTDII corresponds to residues 255–341. The Sis1 dimerization domain (DD) lies between residues 341 and 352. β-Strands are shown in gold, and α-helices are in pink. (C) An enlarged view of the surface of CTDI as depicted in monomer B of (B). The surface shown depicts contours on CTDI with concave areas in gray and convex areas in green. A surface hydrophobic groove that contains 2 shallow depressions is visible. Solvent-exposed residues that line the depression are denoted. F251 and L249 form the base of the individual depressions. Panels in (B) and (C) were rendered from PDB file 1C3G with Rasmol and GRASP software packages, respectively

