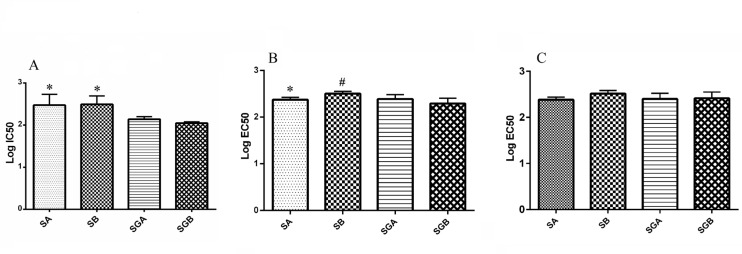
Figure 2.
(A) Log IC50 values of silibinin derivatives (silybin A (SA), silybin B (SB), 3-O-galloyl silybin A (SGA) and 3-O-galloyl silybin B (SGB)) for cell viability in Hep G2 cell line. All data are expressed as mean ± SD. *Significant difference at P<0.05 in comparison to SGA and SGB.
(B) Log EC50 values of studied compounds on caspase-3 activity in Hep G2 cell line. All data are expressed as mean ± SD. *Significant difference at P<0.05 in comparison to SB. #Significant difference at P<0.05 in comparison to SGB.
(C) Log EC50 values of studied compounds on caspase-9 activity in Hep G2 cell line. All data are expressed as mean ± SD. There was no statistically significant difference between the studied compounds.

