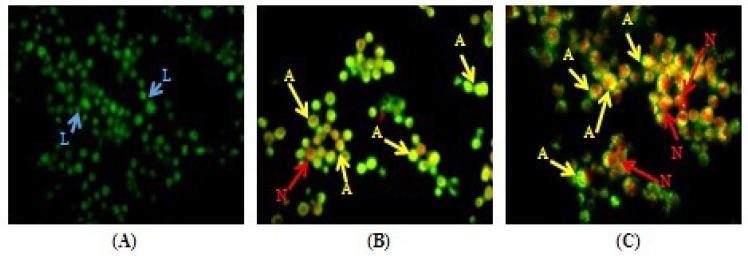
Figure 1.
Morphological changes in DLA cells after 14 days treatment with MEAC extract. For DLA control group (A), MEAC 200 mg/kg (B) and MEAC 400 mg/kg (C). The cells were stained with acridine orange and ethidium bromide. Blue arrows next to "L" point to live cells; Yellow arrows next to "A" indicate apoptotic cells; and Red arrows next to "N" indicate necrotic cells (magnification at 40X).

