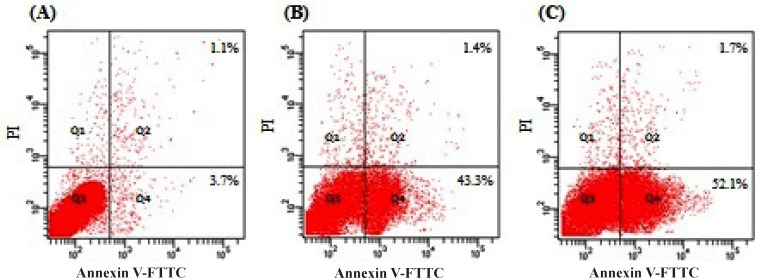
Figure 3.
Flow cytometry analysis for apoptosis inducing activity of MEAC on DLA cells were labeled with PI and Annexin-V FITC Fluos and then fixed and analyzed on a Flowcytometer. DLA control group (A), MEAC 200 mg/kg (B) and MEAC 400 mg/kg (C). Dual parameter dot plot of FITC-fluorescence (x-axis) versus PI-fluorescence (y-axis) has been shown in logarithmic fluorescence intensity. Quadrants: lower left, live cells; lower right, apoptotic cells; upper right, necrotic cells

