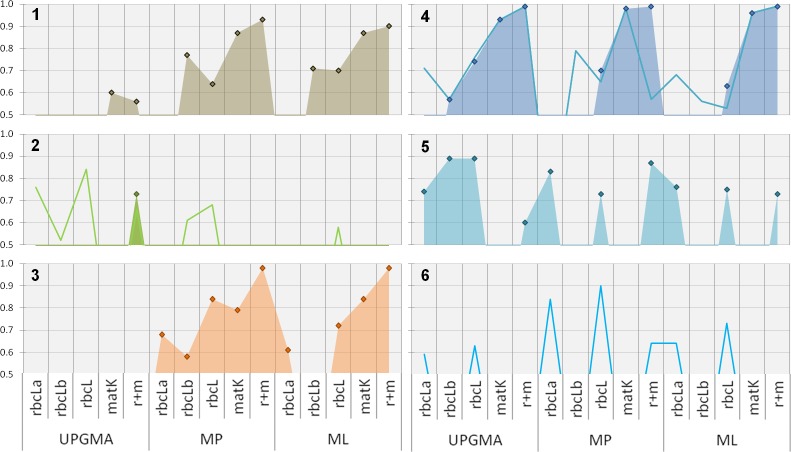
Figure 3. Phylogenetic evaluation of bambusoid clades.
The figure shows statistical support (y-axis, percent bootstrap replicates in decimal form) for relevant clades (1: Bambusoideae, 2: Bambuseae, 3: Olyreae, 4: Arundinarieae , 5: Sasa, 6: Phyllostachys) using UPGMA, MP and ML methodology with single locus (rbcLa, rbcLb and matK-KIM) and multi-locus (rbcL: rbcLa + rbcLb; r+m: rbcL + matK-KIM) data. While diamonds and filled areas indicate statistical support >50% for strict clade composition, lines represent support for alternatives (refer to the results section for further details).

