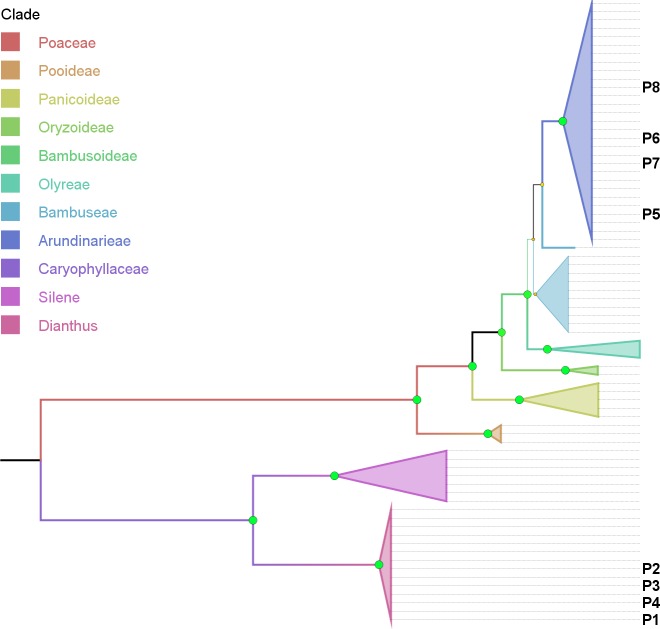
Figure 4. Phylogenetic tree based on combined cytoplasmic sequence data using Maximum Parsimony (MP).
The percentage of replicate trees in which the associated taxa clustered together in the bootstrap test (500 replicates) are indicated by the size and colour (green-yellow-red = 100-50-0%) of the nodes. The analysis involved 74 nucleotide sequences and 1999 positions in the final dataset. P1–P8 indicates the location of sequence data retrieved from product samples.

