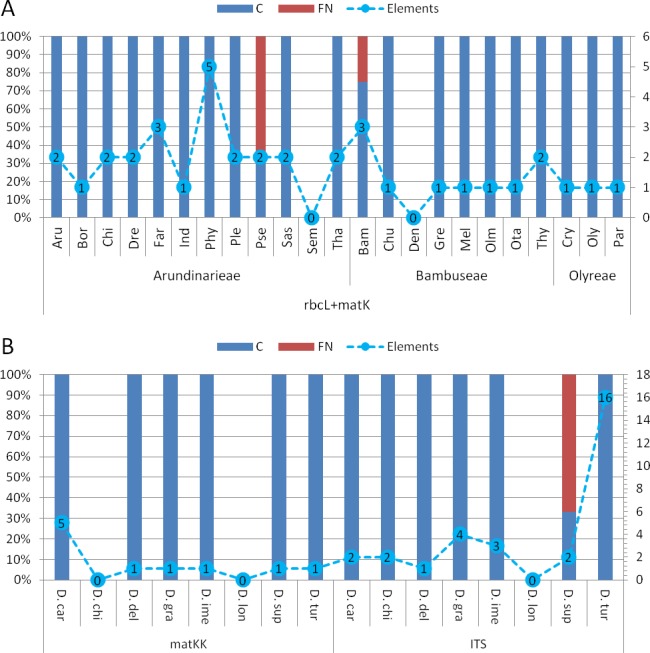
Figure 6. Character based DNA diagnostics.

Barcoding with LOGic formulas (BLOG) analysis of bamboo genera (A) using the combined cytoplasmic dataset (rbcLa, rbcLb and matK-KIM), and Dianthus (B) using matK-KIM and ITS (extended) single marker datasets. Results for Dianthus species that only were present in the extended ITS dataset are not shown. Names of bamboo genera and Dianthus species are abbreviated with the first three letters of the corresponding genus and species name respectively (Table 2 and Table S2). The proportion (in %, primary y-axis) of coverage (C, blue) and false negatives (FN, red) using logic formulas is shown as bars. The number of elements (nucleotide positions) within the LOGic formula are represented by a dashed line graph (secondary y-axis).
