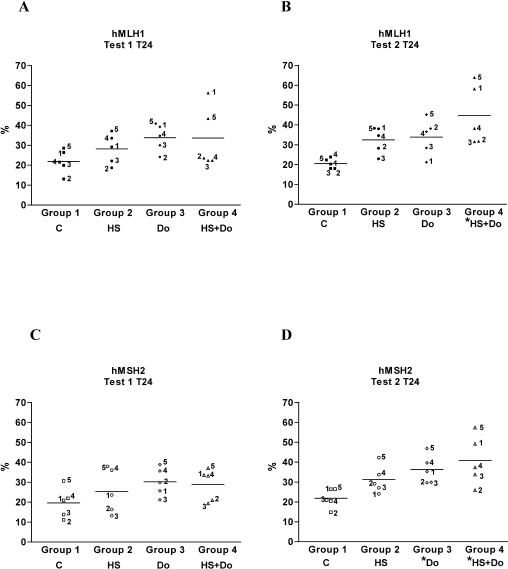
Fig 7.
Expression of the mismatch repair (MMR) proteins hMLH1 and hMSH2 at time 24 (T24). The mean values obtained from the groups 2, 3, and 4, for hMLH1 and hMSH2 and for test 1 and test 2, were greater than the basal level of group 1 (control). Note the significant increased in the mean values of the MMR proteins in group 4 of test 2, which correlates with the higher deoxyribonucleic acid repair capacity reported. There was also a significant difference between group 1 and group 3 *P < 0.05. The numbers on the figure correspond to each studied subject. C: control; HS: heat shock; Do: doxorubicin; HS+Do: heat shock and doxorubicin

