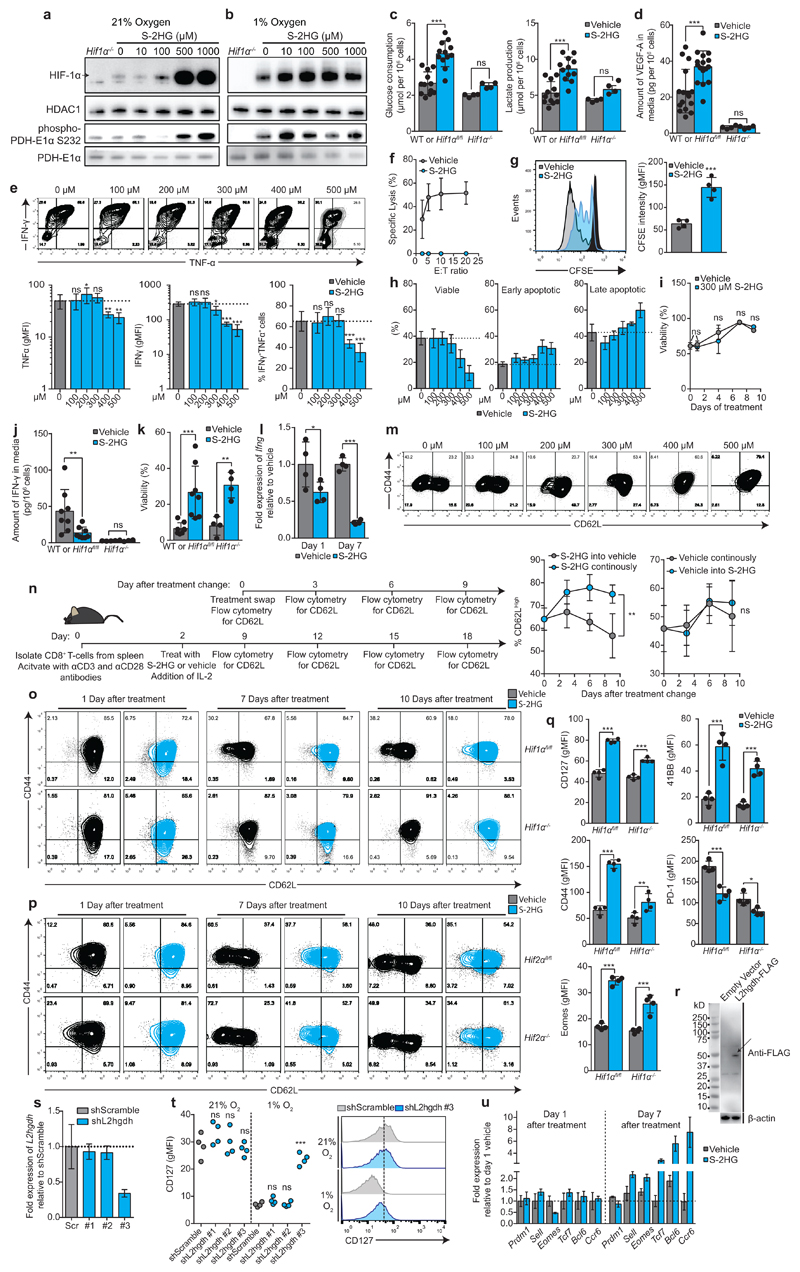
Extended Data Figure 5. S-2HG treatement promotes HIF-1α stability and alters the phenotypic and functional properties of CD8+ T-lymphocytes in a HIF-1α-independent manner.
a-b/ Immunoblot analysis of nuclear and cytosolic fractions, prepared from CD8+ T-lymphocytes cultured in (a) 21% and (b) 1% oxygen, for HIF-1α, HDAC1, phospho-PDH E1α (S232) and total PDH-E1α. Cells were activated for 48 h with αCD3+αCD28 antibodies and then expanded for a further 4 days in the presence of IL-2 followed by treatment with the indicated concentration of S-2HG for 16 hours. The arrow indicates HIF-1α protein.
c/ Glucose consumption and lactate production of C57BL/6J, Hif1αfl/fl (n=12) and Hif1αfl/fldlckcre (n=4) CD8+ T-lymphocytes treated with or without 500 μM S-2HG-octyl ester for 16 hours as in Extended Data Fig. 5a.
d/ VEGF-A production of wild type C57BL/6J, Hif1αfl/fl (n=16) and Hif1αfl/fldlckcre (n=4) CD8+ T-lymphocytes treated with or without 500 μM S-2HG-octyl ester for 16 hours as in Extended Data Fig. 5a.
e/ Representative flow cytometry plots of IFN-γ vs TNF-α in SIINFEKL re-stimulated OT-I CD8+ T-lymphocytes, as a function of increasing doses of S-2HG-octyl ester for 7 days. Associated quantification and statistics are shown in the graphs below.
f/ Specific killing of EG7-OVA cells by OT-I CD8+ T-lymphocytes. Total splenocytes were activated for 48 h with 1000 nM SIINFEKL and then expanded for a further 4 days in the presence of IL-2 followed by treatment with 500 μM S-2HG-octyl ester for 24 h. OT-I CD8+ T-lymphocytes were incubated with target and control cells for 4 hours; n=3 mice per condition.
g/ CFSE dilution assay, with associated statistics (n=4 mice per condition) at day 3 of CD8+ T-lymphocytes activated with αCD3+αCD28 antibodies and cultured with or without 500 μM S-2HG-octyl ester from day 0. Data are representative of 4 mice. Associated quantification and statistics are shown in the graph on the right.
h/ Viability and annexin V assay of CD8+ T-lymphocytes treated with increasing S-2HG doses for 4 days, n=4 mice.
i/ Viability of CD8+ T-lymphocytes cultured with 300 μM S-2HG-octyl ester for the indicated number of days, n=4 mice.
j/ Amount of IFN-γ protein in the media of wild type C57BL/6J, Hif1αfl/fl (n=8) and Hif1αfl/fl dlckcre (n=4) CD8+ T-lymphocytes treated for 24 h with or without 500 μM S-2HG-octyl ester.
k/Viability of Hif1αfl/fl (n=8) and Hif1αfl/fl dlckcre (n=4) OT-I CD8+ T-lymphocytes activated with 1000 nM SIINFEKL peptide and cultured for 7 days with or without 500 μM S-2HG-octyl ester in the absence of IL-2 supplementation from day 0.
l/ Expression of Ifng mRNA in CD8+ T-lymphocytes treated for either 24 h or 7 days with or without 500 μM S-2HG-octyl ester. n=4 mice per group.
m/ CD44 and CD62L surface expression on OT-I CD8+ T-lymphocytes treated with increasing doses of S-2HG for 7 days. Cells were activated with 1000 nM SIINFEKL peptide; n=3 mice. Gated on live, CD8+ cells.
n/ Illustration outlining the workflow for the experiment. Left panel: %CD62LHigh CD8+ T-lymphocytes, treated for 7 days with 500 μM S-2HG-octyl ester, followed by washout or maintenance of the compound and follow up every 3rd day, for 9 more days; n=4 mice. Right panel: %CD62LHigh CD8+ T-lymphocytes, treated for 7 days with vehicle, followed by addition of 500 μM S-2HG-octyl ester or vehicle and follow up every 3rd day, for 9 more days; n=4 mice. Gated on live, CD8+ cells.
o/ CD44 and CD62L surface expression on Hif1αfl/fl and Hif1αfl/fl dlckcre CD8+ T-lymphocytes treated with or without 500 μM S-2HG-octyl ester for 1, 7 and 10 days following treatment. Data are representative of 3 mice per genotype. Gated on live, CD8+ cells.
p/ CD44 and CD62L surface expression on Hif2αfl/fl and Hif2αfl/fl dlckcre CD8+ T-lymphocytes treated with or without 500 μM S-2HG-octyl ester for 1, 7 and 10 days following treatment. Data are representative of 2 mice per genotype. Gated on live, CD8+ cells.
q/ Flow cytometric characterisation of indicated phenotypic markers on Hif1αfl/fl (n=4) and Hif1αfl/fl dlckcre (n=4) CD8+ T-lymphocytes treated for 7 days with 500 μM S-2HG-octyl ester. Gated on live CD8+ cells.
r/ Validation of L2hgdh-FLAG expression in CD8+ T-lymphocytes from C57BL/6J mice by immunoblot analysis for FLAG. The arrow indicates L2hgdh-FLAG protein.
s/ qPCR validation of L2hgdh knockdowns in CD8+ T-lymphocytes isolated from C57BL/6J mice.
t/ CD127 surface expression in response to L2hgdh knockdown (n=4). Representative flow cytometry histogram of CD127 surface levels on transduced (GFP+) CD8+ T-lymphocytes in response to shScramble or shL2hgdh #3 in 21% or 1% oxygen is shown on the right.
u/qPCR quantification of Prdm1, Sell, Eomes, Tcf7, Bcl6 and Ccr6 expression in CD8+ T-lymphocytes treated for 1 or 7 days with or without 500 μM S-2HG-octyl ester .
Paired t-test for matched comparisons (g) and two-way ANOVA for grouped data (c, d, j, k, l, q). One-way ANOVA for multiple comparisons (i, n, t). Error bars denote s.d. and each dot in c, d, g, j, k, l, q, t represents an individual mouse. ns=non-significant, *p<0.05, **p<0.01, ***p<0.001. gMFI=geometric mean fluorescence intensity. Experiments were performed with indicated numbers of mice from multiple occasions. For immunoblot source images, see Supplementary Fig. 1.

