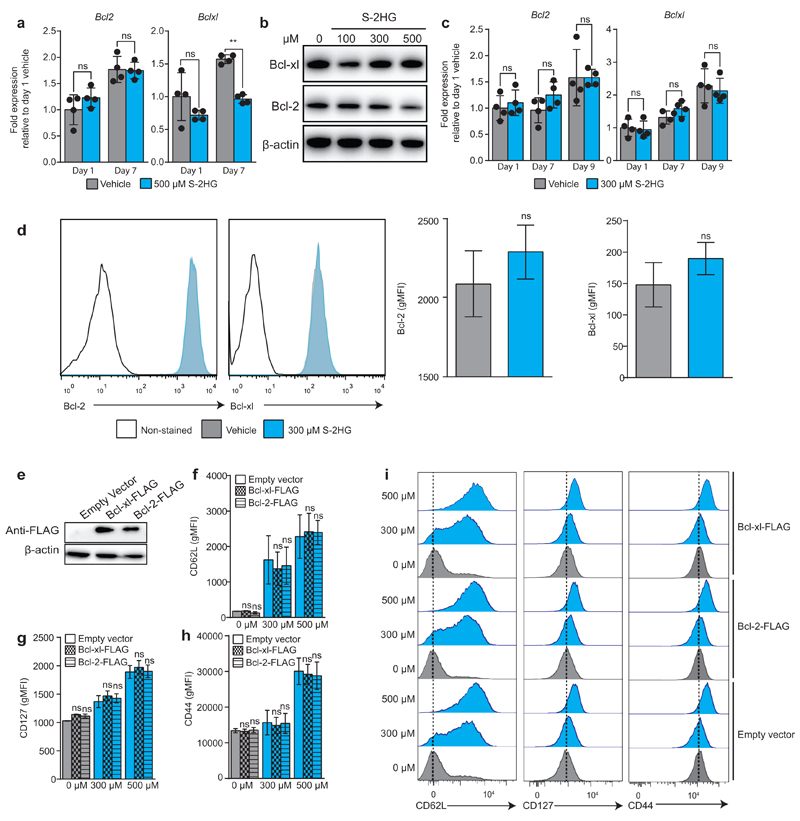
Extended Data Figure 8. S-2HG does not induce Bcl-2 or Bcl-xl that can explain the in vivo persistence of adoptively transferred CD8+ T-lymphocytes.
a/qPCR quantification of Bcl2 and Bclxl mRNA levels in response to 500 μM S-2HG-octyl ester treatment for either 1 or 7 days. n=4 mice
b/Immunnoblot analysis for Bcl-2 and Bcl-xl protein in response to increasing doses of S-2HG-octyl ester for 9 days.
c/qPCR quantification of Bcl2 and Bclxl mRNA levels in response to 300 μM S-2HG-octyl ester treatment for either 1, 7 or 9 days. n=4 mice
d/Representative flow cytometry histograms of Bcl-2 and Bcl-xl abundance in CD8+ T-lymphocytes treated with 300 μM S-2HG-octyl ester for 9 days. Quantification and associated statistics are shown in the graph on the right. n=3 mice.
e/Immunoblot analysis confirming the expression of Bcl-xl-FLAG and Bcl-2-FLAG in OT-I in CD8+ T-lymphocytes.
f-h/CD62L (f), CD127 (g) and CD44 (h) surface expression in OT-I CD8+ T-lymphocytes transduced with retrovirus expressing either Bcl-2-FLAG or Bcl-xl-FLAG and treated with the indicated concentration of S-2HG-octyl ester for 7 days. n=2 mice
i/ Representative flow cytometry histograms of CD62L, CD127 and CD44 surface expression in OT-I CD8+ T-lymphocytes transduced with retrovirus expressing either Bcl-2-FLAG or Bcl-xl-FLAG and treated with the indicated concentration of S-2HG-octyl ester for 7 days. The associated statistics of these flow cytometry data are shown in f, g and h. **P<0.01, ns= non-significant.
Paired t-test for matched comparisons (d) and two-way ANOVA for grouped data (a, b). One-way ANOVA of matched samples for multiple comparisons (c, f, g, h). Error bars denote s.d. and each dot in a and c represents an individual mouse. ns=non-significant, **p<0.01, gMFI=geometric mean fluorescence intensity. Experiments were performed with indicated numbers of mice from at least two occasions. For immunoblot source images, see Supplementary Fig. 1.

