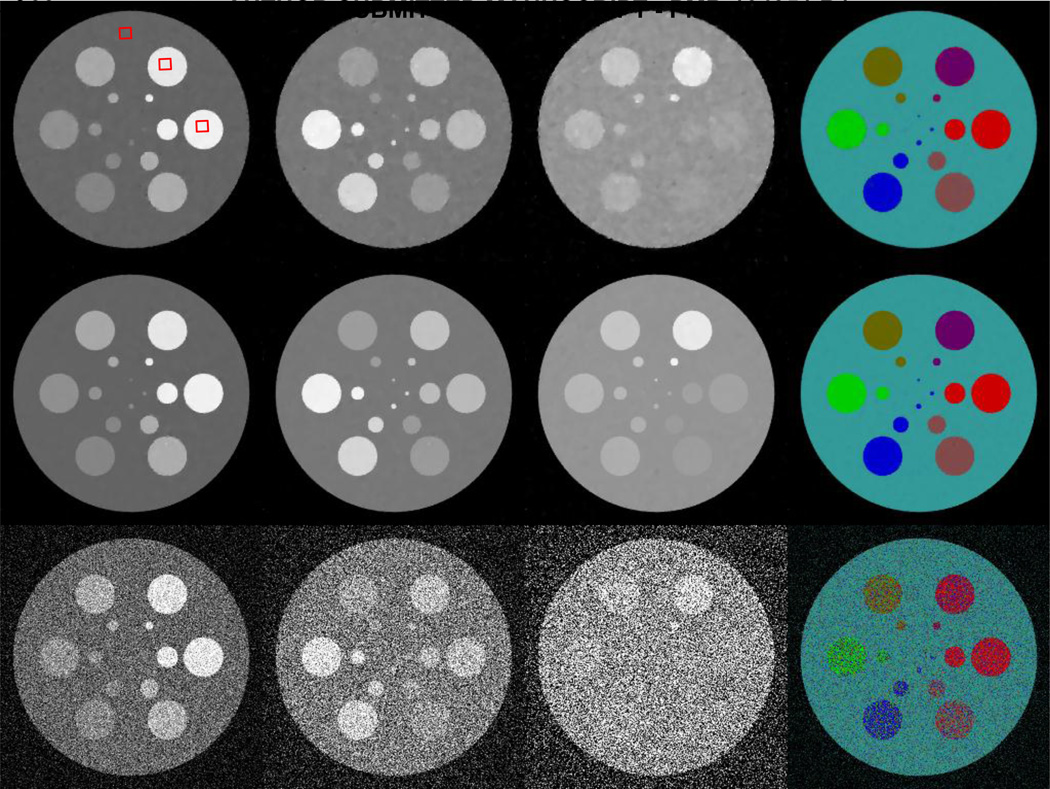
Fig. 2.
Spectral reconstruction results from noisy projections assuming 2× 10⁴ incident photons per detector element. From top to bottom rows, the images are reconstructed by the StTV, AdSA and FBP, respectively. The images in the first three columns, from left to right, are for the 1st, 4th and 8th channels respectively, and the display windows are [0 1], [0 0.5] and [0 0.3] cm−1 respectively. The last column shows the corresponding material decomposition results.

