
Figure 3.
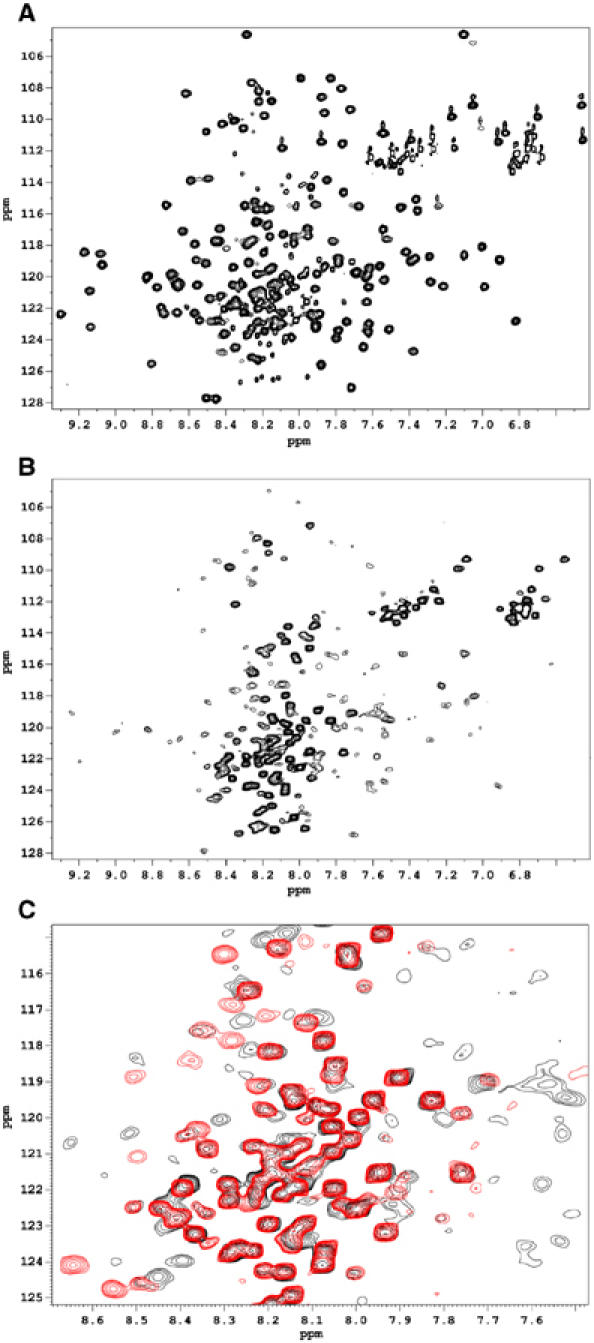
NMR analysis of the talin/vinculin interaction. Two-dimensional [15N/1H]HSQC spectra of uniformly 15N-labelled talin polypeptides. (A) Free talin (482–655). (B) Free talin (482–636). (C) Superposition of the spectra of talin (482–636) free in solution (black) and in the presence of 1.5 molar excess of Vh′ (red).