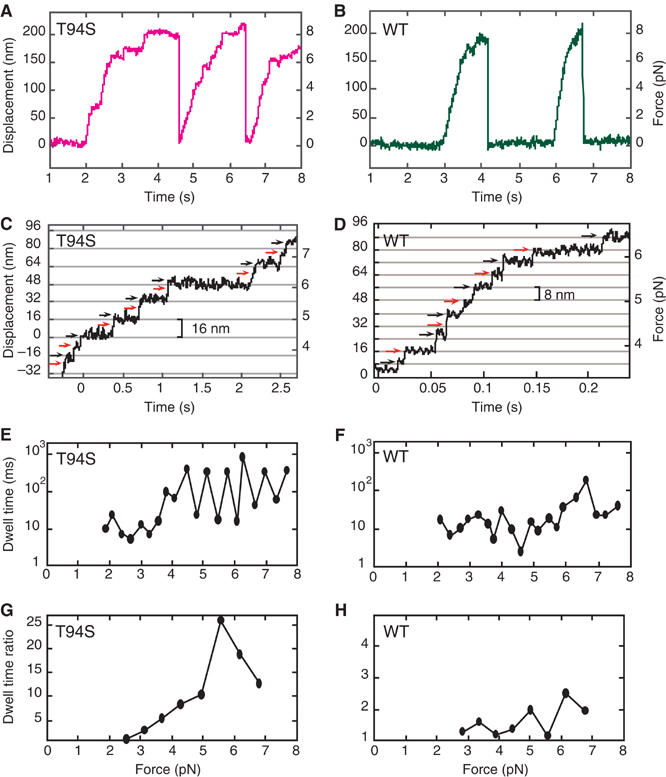
Figure 2.

Single-molecule laser-trap assays of kinesin-T94S and wild-type kinesin. (A, B) The traces show processive movement by single kinesin-T94S (magenta) and wild-type kinesin (green) motors. (C, D) Single kinesin-T94S motors showed successive 8-nm steps at forces <∼4 pN, but exhibited successive 16-nm displacements, consisting of rapid double 8-nm steps, at forces >∼4 pN. Single wild-type kinesin motors under the same conditions showed sequential 8-nm steps. (E, F) A plot of dwell time versus force shows alternating short and long dwells following sequential 8-nm steps by the kinesin-T94S mutant. The wild type shows variable dwells following sequential 8-nm steps. (G, H) The ratios of the long dwell times divided by the short dwell times at different forces, calculated by averaging overlapping sets of three successive odd and even steps (see Materials and methods) corresponding to the traces in (C, D). The dwell time ratios or limp factors L of the mutant are significantly greater than those of wild type at forces >∼4 pN. Note the difference in Y-axis scales in (G, H).
