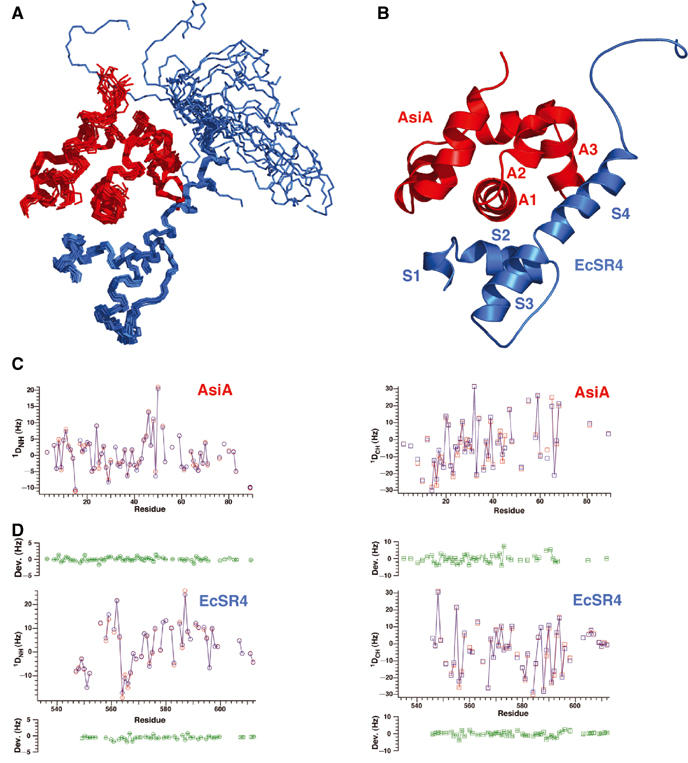
Figure 4.

Three-dimensional structure of the AsiA/EcSR4 complex. (A) Superposition of the 20 conformers of the complex, with EcSR4 shown in blue (residues 545–613) and AsiA shown in red (residues 2–90). Residues 72–75 and residue 85 of AsiA were exchange broadened in the complex and not identified. Residues 533–544 of EcSR4 were disordered in the complex and are not shown. (B) Summary of the secondary structure elements of the AsiA/EcSR4 complex. (C) Comparison of observed (red) and calculated (blue) 1D couplings for NH (left panel) and CαH (right panel) as a function of residue number in AsiA. The mean deviation between calculated and observed couplings over the structure family is plotted in green±observed error from the mean for each measured coupling. (D) Comparison of observed (red) and calculated (blue) 1D couplings for NH (left panel) and CαH (right panel) as a function of residue number in EcSR4 displayed as in (C). The calculated couplings for NH and CαH were determined by SVD analysis with the program DC, as described in Materials and methods.
