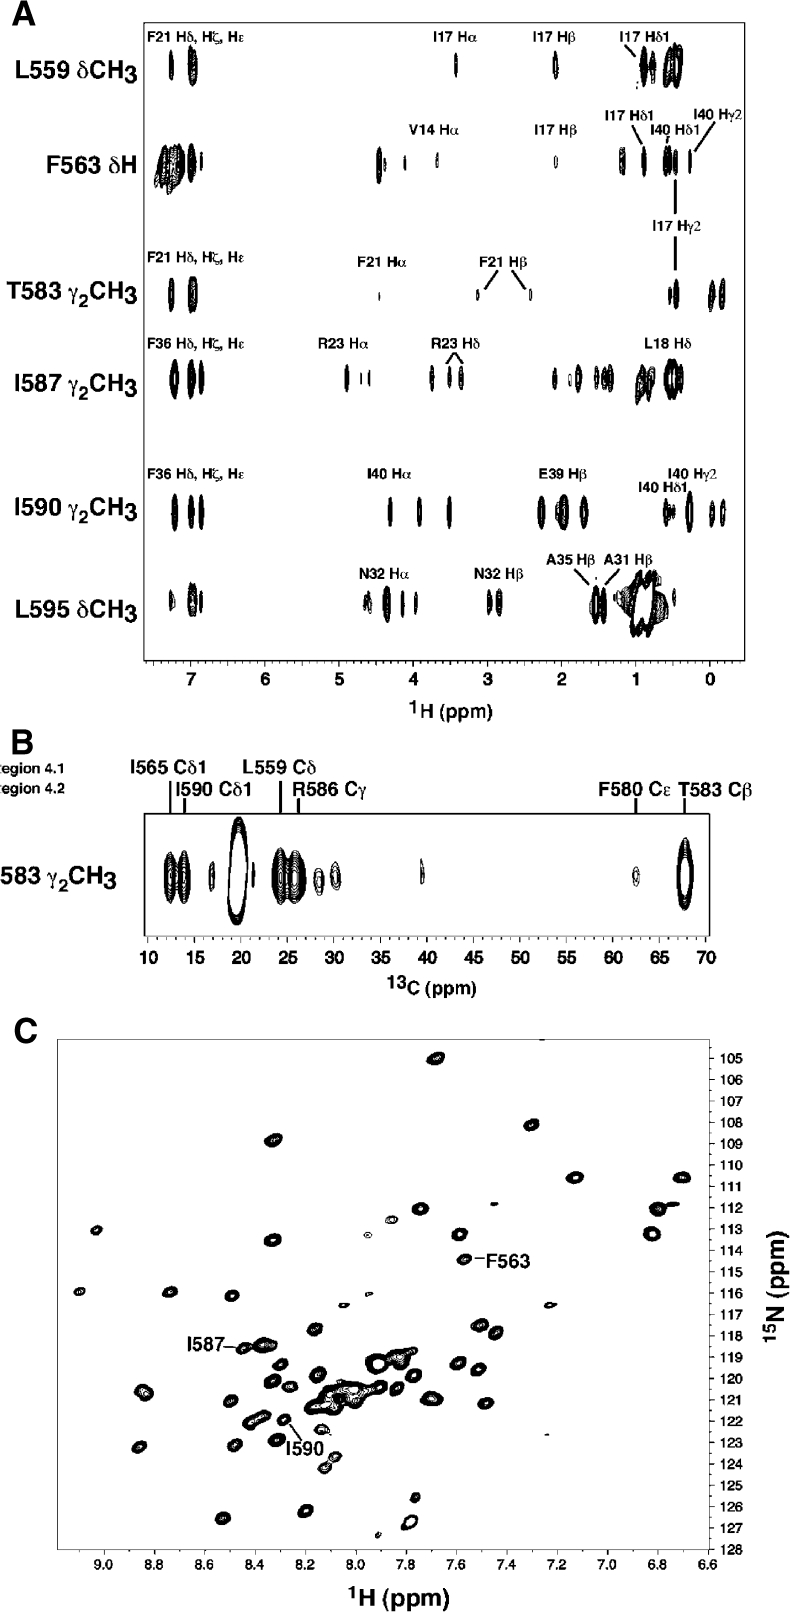
Figure 7.
Spectroscopic analysis of AsiA/EcSR4. (A) Cross sections of a 13C-F1-edited/F2-filtered NOESY spectrum taken at the 13C/1H chemical shifts of the indicated residue positions in EcSR4. Selected assignments to the 1H chemical shifts in AsiA are shown. Residues in region 4.1 (L559 and F563) and region 4.2 (T583) contact the same position in AsiA (I17) with comparable intensities. (B) 13C-edited NOESY spectrum of the side-chain methyl group from T583 observed in 13C/15N-EcSR4 in the AsiA/EcSR4 complex. The 1H chemical shift of the T583 Hγ2 methyl group shifts upfield by ≈1.5 ppm in the complex relative to the chemical shift of this group in TmSR4. T583 forms unique contacts in the complex with the indicated residues in both regions 4.1 and 4.2 in EcSR4. The NOESY spectrum illustrates that this residue is turned inward in the complex, away from its position in the free TmSR4 domain. The portion of the spectrum shown displays the 13C chemical shifts in lieu of the 1H chemical shifts due to 13C frequency labeling of the protons during t1 in the experiment. (C) 1H–15N HSQC spectrum of EcSR4 bound to AsiA. The indicated residues in region 4.1 (F563) and region 4.2 (I587 and I590) specifically interact with AsiA (see Figure 5) and are clearly seen to be single peaks in the spectrum, indicative of a single species in solution.

