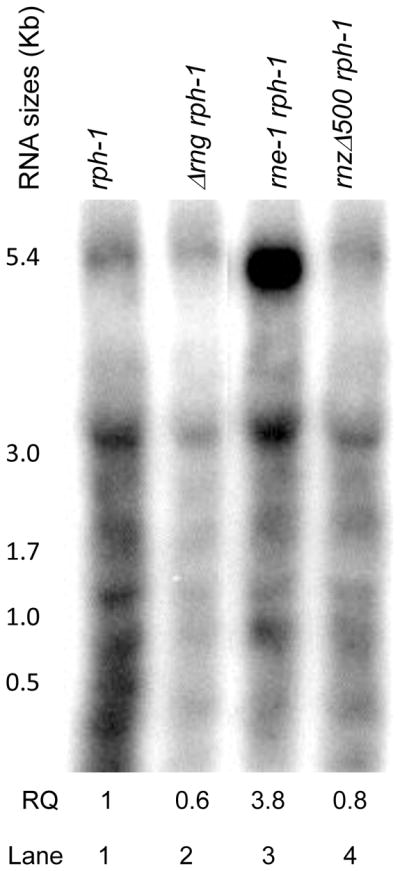
Figure 3.

Northern analysis of the rpsJ primary transcript. Total RNA was isolated and separated on a 1.5% glyoxal agarose gel as described in the Experimental Procedures. Lane 1, MG1693; lane 2, SK2538; lane 3, SK5665; lane 4, SK9795. The sizes of the various transcripts are indicated on the left of the blot and are based on a RNA sizing ladder (Riboruler™, Fermentas). Lanes that were not relevant were removed from the blot. The blot was scanned using a STORM 840 PhosphorImager (GE Healthcare) and the intensities of the bands were quantified using ImageQuant TL 5.2 software. The relative quantity (RQ) of the full-length transcript compared to the MG163 control is shown below each lane and represents the average of three independent determinations.
