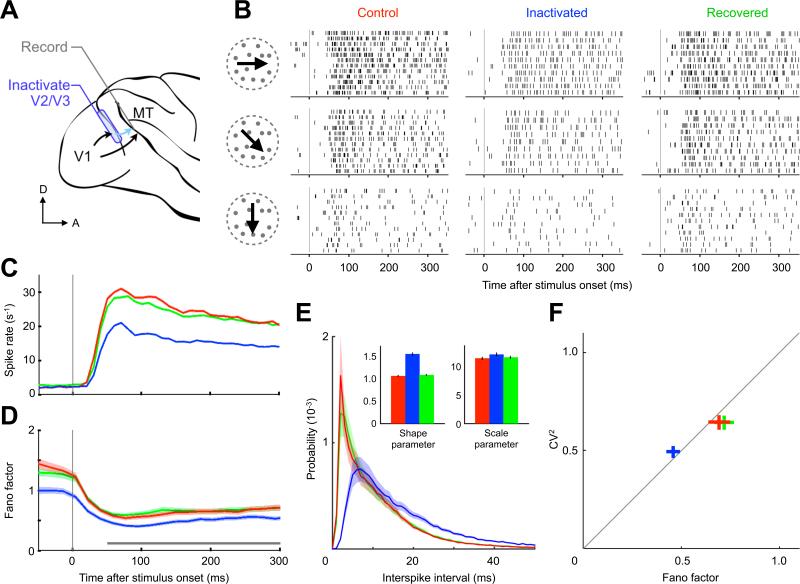
Figure 1. Bottom-up Input Inactivation Reduces Neuronal Variability.
(A) Single MT neurons in the alert macaque were recorded with bottom-up sources V2 and V3 intact (control, red), inactivated (blue) and later recovered (green). Data are presented according to this color scheme hereafter. (B) Spike raster from one neuron during a 350 ms random dot stimulus for three directions of motion. During inactivation, trial-to-trial variability and spike train irregularity decrease. (C) Spike rate and (D) Fano factor averaged over 39 neurons (shading represents SEM; gray bar indicates estimation window for next panels). The spike rate and the trial-to-trial variability decrease upon input inactivation. (E) Interspike interval histogram averaged over the population. Inset shows mean and 95% confidence interval of fitted gamma distribution parameters (excluding 2 ms refractory period). The increase in the shape parameter indicates that the intervals become more regular during inactivation due to a disproportionate reduction of short intervals. (F) Population mean ± SEM of interval CV2 versus spike count Fano factor.

