
Figure 1.
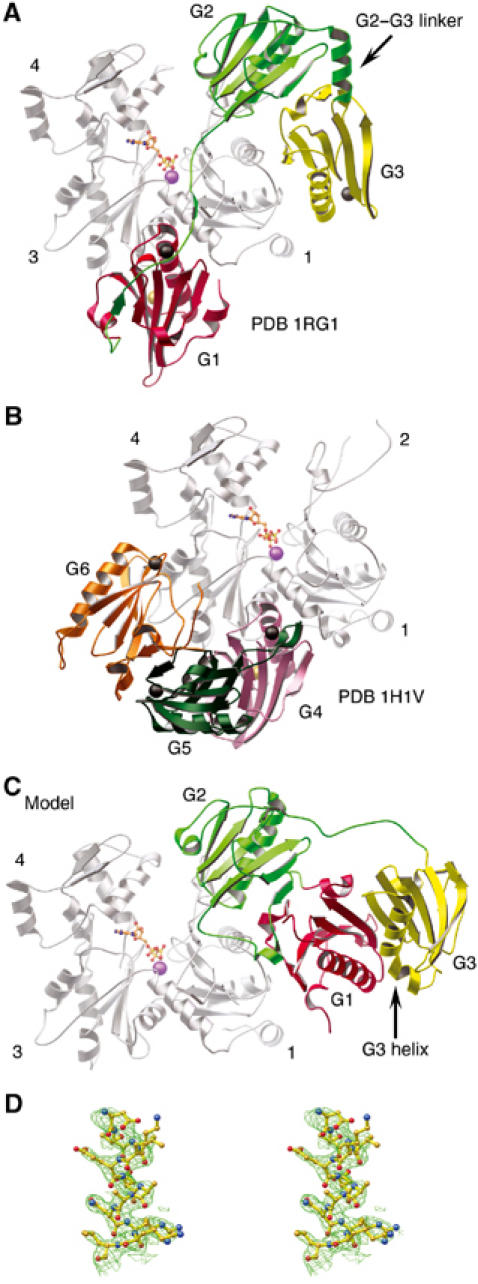
The structure of the G1–G3:actin complex. (A) A schematic representation of the G1–G3:actin complex. The gelsolin domains are colored: G1, red; G2, green; G3, yellow. This scheme is preserved in subsequent figures unless explicitly stated. Actin, with subdomains 1, 3 and 4 indicated, is colored gray. ATP is shown as a ball-and-stick representation with its associated Ca2+ in purple. Type-1 and type-2 Ca2+ ions are depicted as gold and black spheres, respectively. (B) The structure of the G4–G6:actin complex (PDB 1H1V; Choe et al, 2002) for comparison. Gelsolin domains are colored: G4, pink; G5, dark green; G6, orange. (C) Model of Ca2+-free G1–G3 interacting with actin: obtained by taking the structure of G1–G3 excised from Ca2+-free, inactive gelsolin (PDB 1D0N; Burtnick et al, 1997) and positioned on actin, in accord with the overlaying of G2 onto the structure presented in (A). (D) Stereo view of a representative portion of the 2Fo–Fc electron density map contoured at 1σ.