
Figure 2.
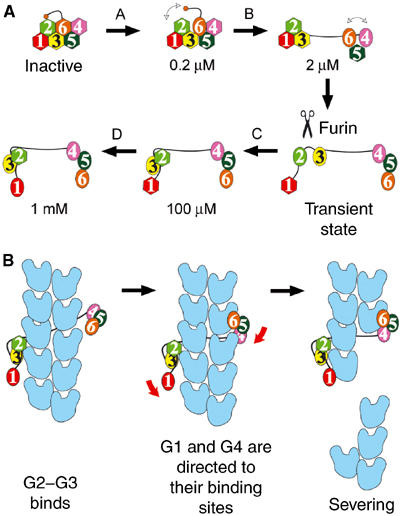
Calcium-induced activation of gelsolin and the severing of F-actin. (A) Levels of calcium activation. Ca2+-free gelsolin domains are shown as hexagons and calcium-bound domains are depicted as ovals. Calcium ion concentrations are indicated for each step. The scissors represent the stage at which FAF gelsolin is cleaved. (B) The sequence of events during severing of actin by fully activated gelsolin. Actin protomers are shown in blue.