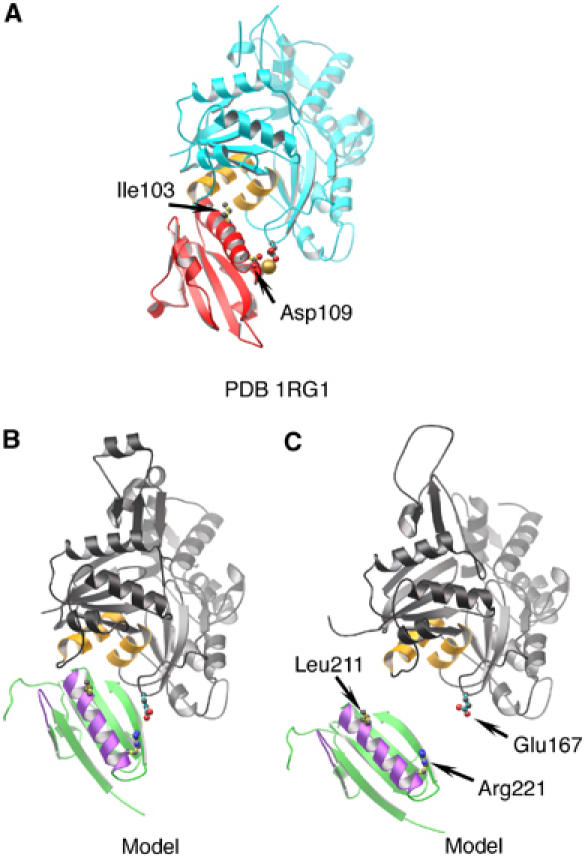
Figure 5.

Comparison of the G1 (structure) and G2 (model) interfaces with actin. (A) G1:actin structure (from 1RGI). G1 is red, with Ile103 and Asp109 drawn. The type-1 calcium ion is shown as a gold sphere. Actin is depicted cyan, with two relevant hydrophobic helices painted orange and residue Glu167 indicated. (B) The G2:actin interaction within the model presented in Figure 4A. G2 is shown in green, with F-actin contact regions in purple (Van Troys et al, 1996; Puius et al, 2000) and residues Leu211 and Arg221 indicated. An actin protomer is depicted in gray, with the two hydrophobic helices in orange and residue Glu167 drawn in. (C) G2 docked onto the EM model for the open conformation of an actin filament (Belmont et al, 1999).
