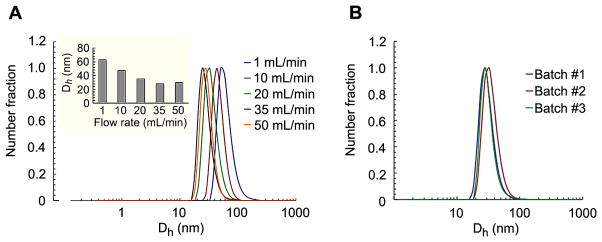
Figure 3.
Effect of the flow rate on number average size distribution of lPEI/DNA nanoparticles (A); insert graph sows mean number average particle size for the flow rates tested. Inter-batch variability for lPEI/DNA nanoparticles prepared at a flow rate of 40 mL/min. lPEI/DNA nanoparticles were prepared at an initial DNA concentration of 100 μg/mL, N/P= 8, and pH of lPEI solution is 3.5.

