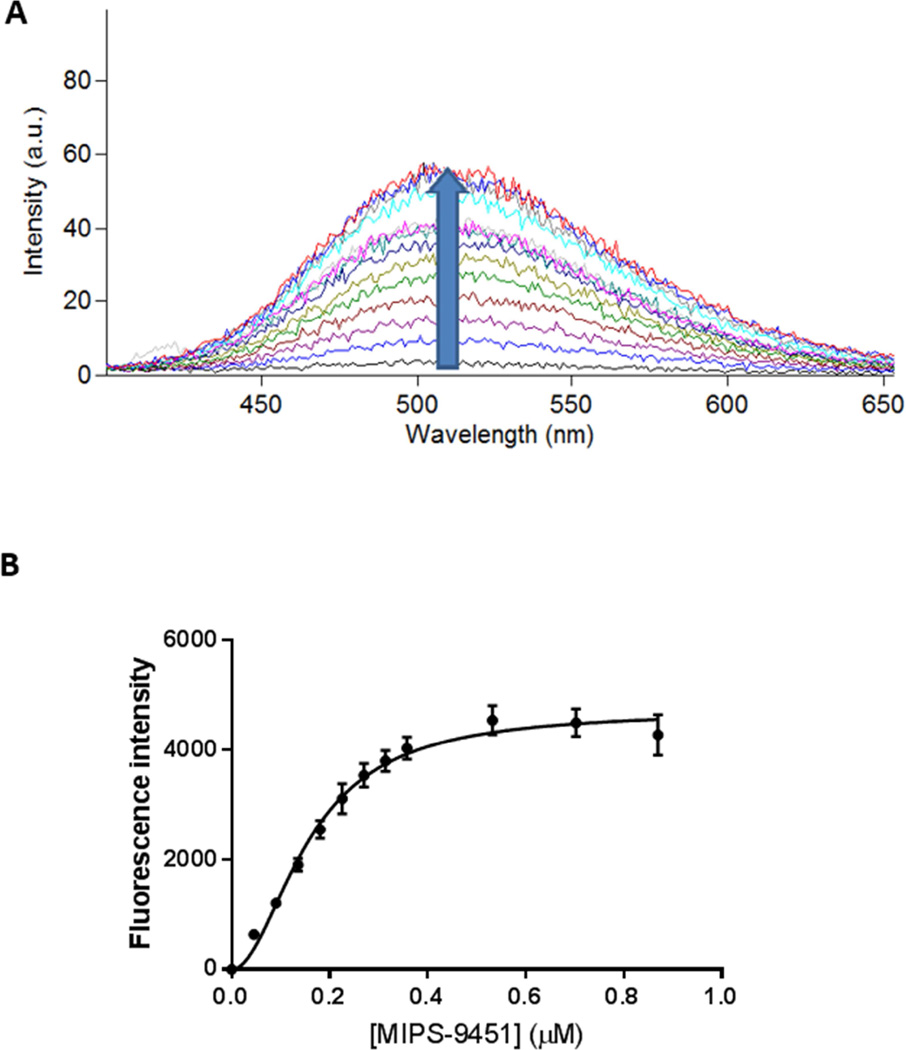
Figure 1.
A) Representative emission spectra illustrating fluorescence enhancement upon the titration of increasing MIPS-9451 concentration into S. enterica (typhimurium) LPS, where the upward arrow indicates a rise in the curve upon successive titrations and B) area under curve of each titration plotted as a function of MIPS-9451 concentration. Data are presented as mean ± SD (n = 3) and are fitted to a Hill-slope augmented one-site specific binding model.

