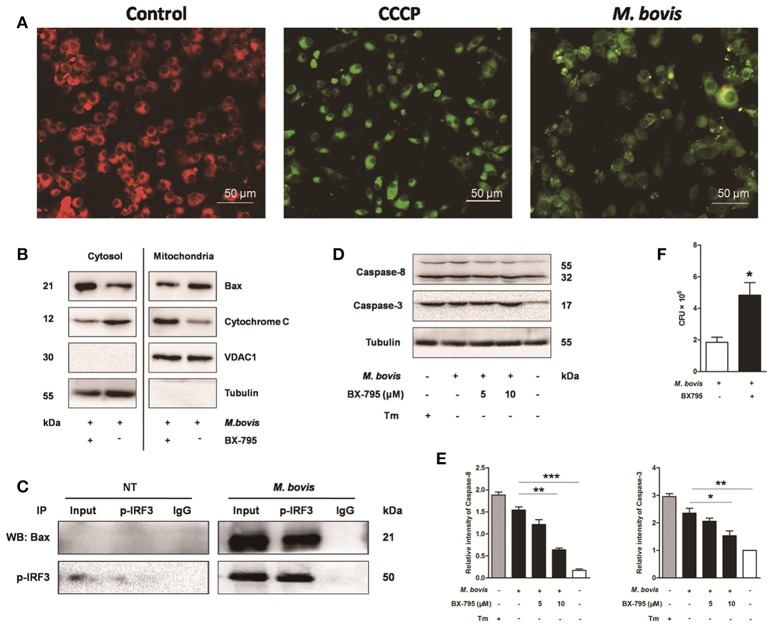
Figure 6.
IRF3 causes the mitochondrial damage and caspase-8 activation. Raw 264.7 cells were untreated or treated with M. bovis at an MOI of 10 for 24 h. (A) Mitochondrial transmembrane potential (ΔΨm) is measured using JC-1 as the fluorescent marker. The JC-1-aggregate form, indicating normal ΔΨm, appears red and the monomeric form, indicating low ΔΨm (i.e., disrupted mitochondrial membrane), is green by confocal microscopy. Carbonyl cyanide m-chlorophenylhydrazone (CCCP), as a positive control for the mitochondrial damage. Scale bar = 50 μm. (B) Mitochondrial fractions were isolated from whole cell lysates from Raw 264.7 cells. Mitochondrial fractions and supernatant were immunoblotted for the indicated proteins. Left and right parts represent the same membrane. (C) Samples were immunoprecipitated with control IgG or anti-phospho-IRF3. Whole-cell lysate (input) or immunoprecipitations were resolved by SDS-PAGE and immunoblotted with anti-phospho-IRF3 or Bax. (D) BX-795 was treated before M. bovis infection in Raw 264.7 cells and total cell lysates were subjected to Western blot for cleaved caspase-3 (p17 specific) and caspase-8. (E) Bands corresponding to each protein were quantified, and the intensities of each protein were normalized to the intensity of tubulin. (F) Quantification of intracellular survival of M. bovis in Raw 264.7 cells pretreated for 3 h with BX-795 (10 μM). Cells were harvested at 24 h post infection with M. bovis and bacteria number was determined by CFU counting. Data are representative of at least three independent experiments, each performed in triplicate with similar results. The asterisks indicate significant differences compared with untreated cells (*P < 0.05, **P < 0.01, ***P < 0.001).

