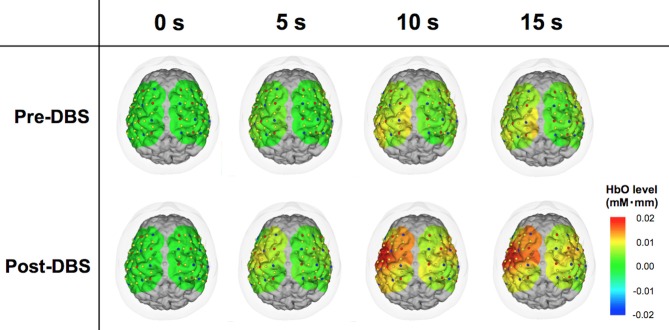
Figure 2.
Comparison between pre- and post-deep brain stimulation (DBS) cortical activity in a representative case. The color map representing cortical activity superimposed onto the three-dimensional brain model was produced from the patient’s T1-weighted magnetic resonance imaging (MRI) image. Red and blue dots indicate the light sources and detectors, respectively. Yellow dots are channels formed by the combinations of the light sources and receivers. These images demonstrate the dynamic oxy-hemoglobin (HbO) response to motor task at 0, 5, 10 and 15 s. At 0 s, the levels of the measured areas were all corrected to zero. Cortical activity in the wide areas of operated-upon hemisphere increased following DBS surgery.

