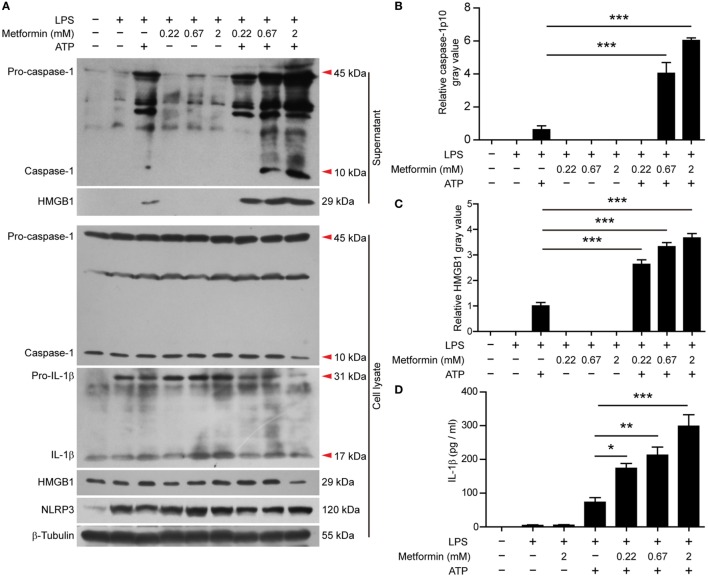
Figure 4.
Metformin enhanced adenosine triphosphate-induced inflammasome activation in J774A.1 cells. (A) Cells were treated as described in Figure 1. Indicated protein levels in both cell lysates and supernatants were evaluated by western blotting. β-Tubulin was used as a loading control for cell lysates. (B,C) Quantitative analyses of active caspase-1p10 (B) and HMGB1 (C) levels in the supernatants (A). (D) Quantification of soluble interleukin-1β levels in the cell culture supernatants by cytometric bead array assay. Data are shown as mean ± SD (n = 3). One representative experiment from three independently performed experiments with similar results is shown. *P < 0.05; **P < 0.01; and ***P < 0.001.

