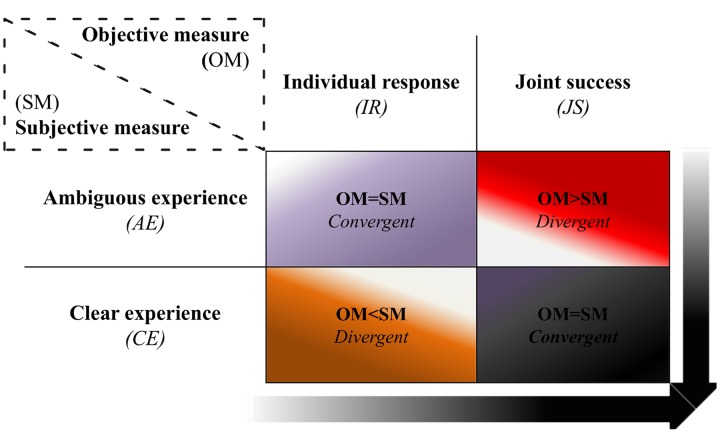
FIGURE 3.
Classification of social interaction. The black cell represents the most social way of interacting, in which both players succeeded in making a correct click and also reported having had a clear experience of each other. In contrast, the opposite cell (purple) stands for a less social way of interacting, since the objective and subjective evaluations show that encounters were uncoordinated (individual response only) and ambiguous. The sample sizes for each cell are referred in the main text. The arrows correspond to the gradient toward which the quality of interaction moves from less to more social interaction, being optimal in the lower right corner. OM, objective measure; SM, subjective measure; IR, individual response; JS, joint success; AE, ambiguous experience; CE, clear experience.

