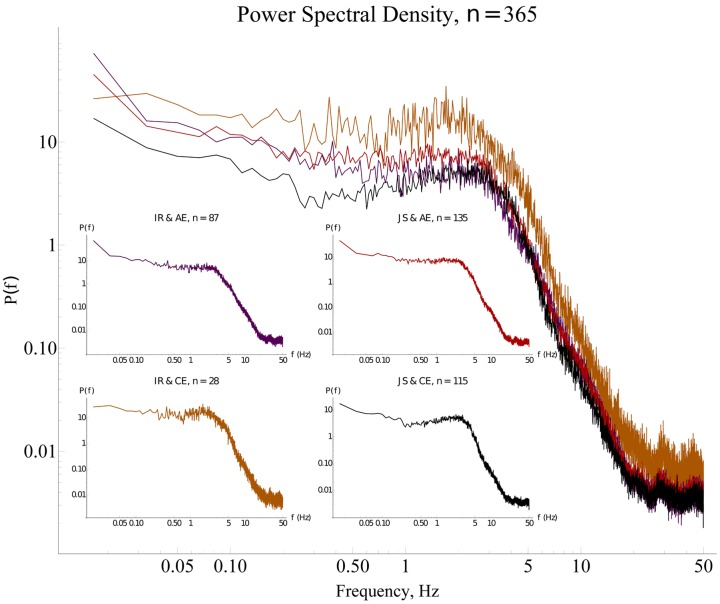
FIGURE 5.
Power spectra for different types of interaction. The median Fourier spectra for the four modalities of social interaction have similar shapes with a broad maximum in the range 0.5–5 Hz, and negligible power for higher frequencies. The time-series from the purple and black spectra (convergent cases) show less variability as shown by the smaller area under the spectra, in contrast with the orange and red spectra (divergent cases) in which the surface beneath the spectra are bigger. Insets: The red spectrum has the highest power; the purple and the black spectra have the smallest power; and the orange spectrum has intermediate power. The x axes are trimmed at the maximal possible frequency’s value according to Nyquist’s theorem (see details in Section “Fourier Spectral Analysis,” and in “Fourier Spectral Analysis” of the Supplementary Material). IR, individual response; JS, joint success; AE, ambiguous experience; CE, clear experience.

