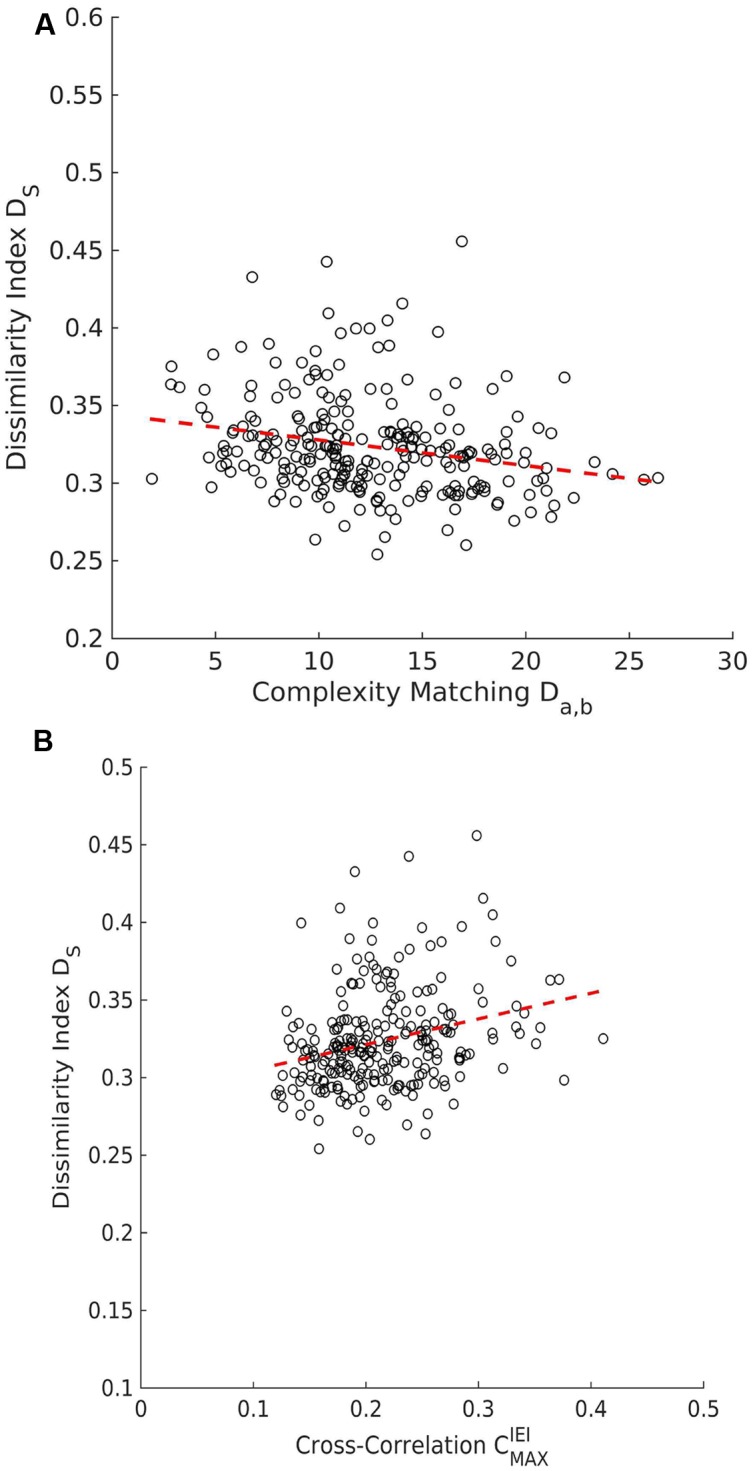
FIGURE 8.

Scatter plots for SPIKE-distance. (A) There is a negative correlation between the dissimilarity index Ds and complexity matching (Da,b).
(B) The dissimilarity index Ds and the maximum peak of the cross-correlation of IEI  show that are positively correlated positive correlation.
