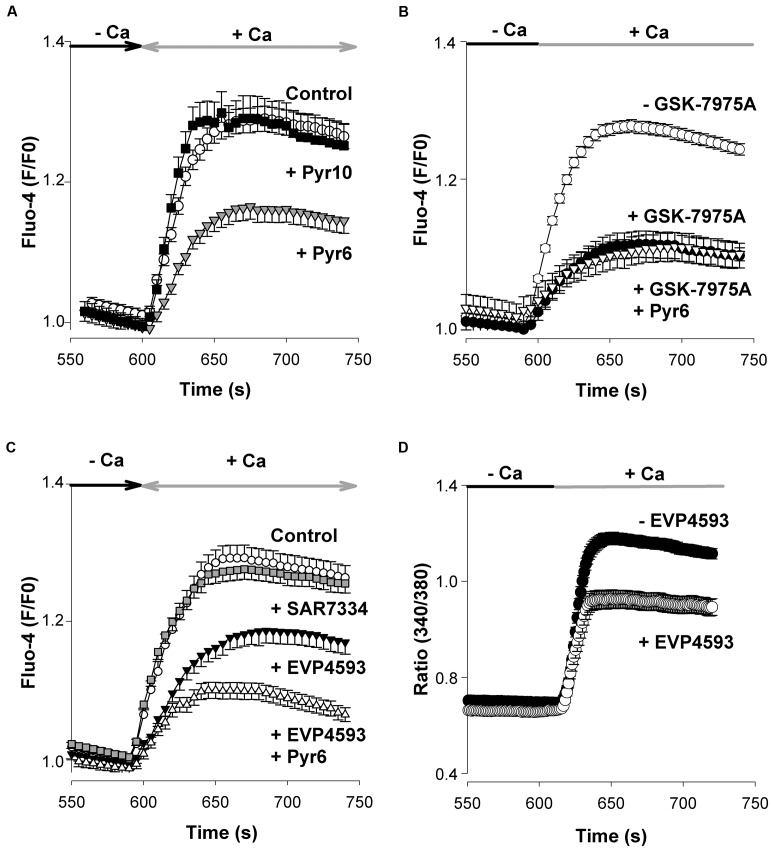
FIGURE 3.
Pyr6, GSK-7975A, and EVP4593 inhibit SOCE but not SAR7334. (A) In these experiments Fluo-4 loaded cells were processed as in Figure 2. Pyr6 (gray triangles, n = 113 cells) or Pyr10 (filled squares, n = 96 cells; 1 μM) was added to the saline recording medium at time +60 s and remained present till the end of the experiment. Open circles: untreated (control) cells (n = 107). (B) Same experiments as in A except 5 μM GSK-7975A (filled circles, n = 118 cells), or GSK-7975A (5 μM) + Pyr6 (1 μM, open triangles, n = 73 cells, data from 2 cell cultures) were added to the saline at time +60 s prior to the application of Tg and remained present throughout the recording. Open circles: untreated (control) cells (n = 63 cells). (C) Same protocol as in A except SAR7334 (1 μM, gray squares, n = 134 cells), EVP4593 (1 μM, filled triangles, n = 112 cells), or EVP4593 (1 μM) + Pyr6 (1 μM; open triangles, n = 62 cells), were added at time +60 s. Open circles: untreated (control) cells (n = 117 cells). The joint application of EVP4593 (1 μM) + Pyr6 (1 μM) was tested on two cell cultures. None of the substance tested affected the Tg-evoked Ca2+ response (not shown). (D) EVP4593 depressed SOCE in RBL-2H3 cells. The effect of EVP4593 on native Orai channels from RBL-2H3 was tested by means of Fura-2 Ca2+ imaging experiments according to experimental procedures already described (Schleifer et al., 2012). EVP4593 (300 nM, open circles, n = 41 cells) was added to the saline at time +60 s prior to the application of Tg (200 nM) and remained present throughout the recording. Filled circles: Control (EVP4593 untreated) cells (n = 52). EVP4593 significantly reduced the peak amplitude of the native SOCE (p < 0.001, Student’s t-test). The graphs (A–D) show the last 200 s of the recording. Mean ± SEM.

