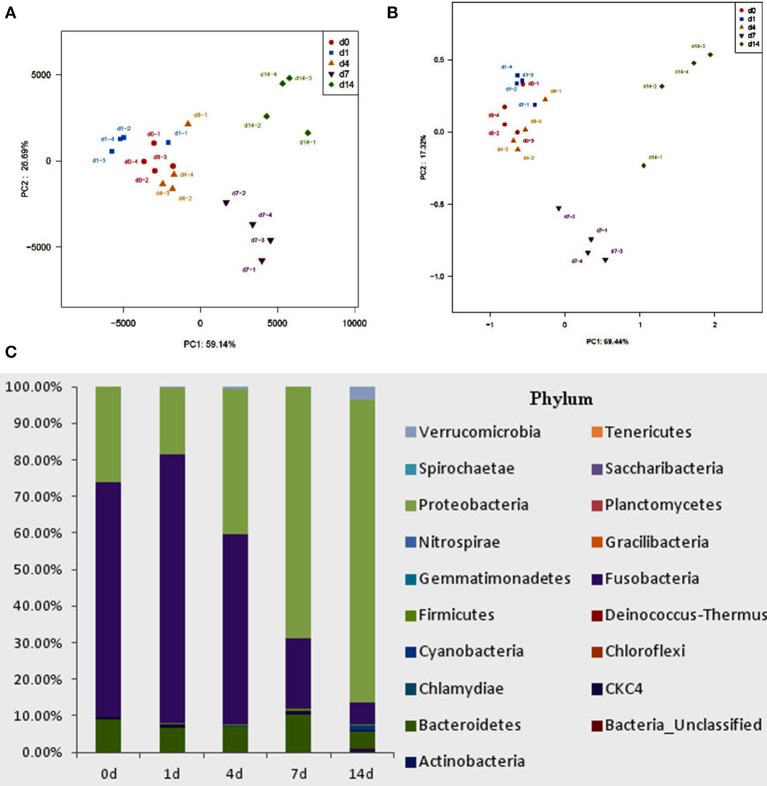
Figure 5.
Bacterial community analysis of goldfish gut content fed with or without QSI-1. (A,B) principal component analysis (PCA) and principal coordinates analysis (PCoA) plots using Bray-Curtis metric and weighted Unicfrac distances, respectively. (C) Relative abundance of microbial genera (percentages) in the gut of fish fed with and without QSI-1 diets (n = 4).

