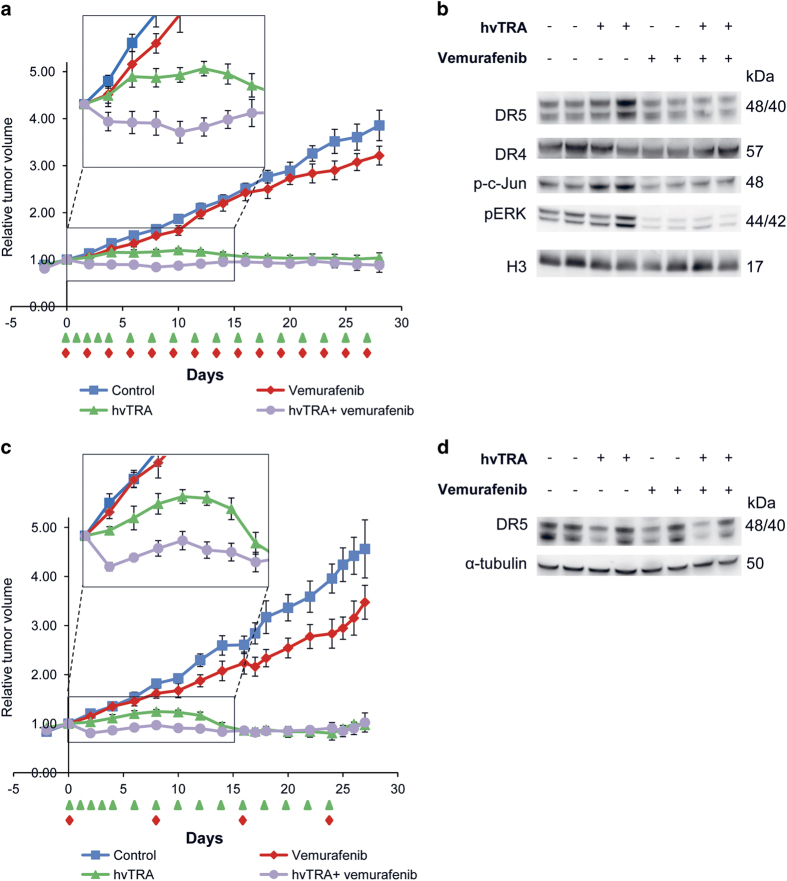
Figure 6.
Growth reducing capacity of hvTRA, vemurafenib and the combination with reduced concentrations of vemurafenib. Melmet 5 xenografts were treated with hvTRA ( ) (3 mg/kg), vemurafenib (
 ) ((a) 50 mg/kg every second day) or (c) 50 mg/kg twice a day every 8th days) or the combination of hvTRA and vemurafenib (
 ). The treatment schedule is indicated in the figure by
  and
and  . The tumors were measured twice or thrice a week using a caliper, and are presented as relative tumor volume related to the tumor volume at the initiation of the treatment. Eight tumors are included in each group in a, and five tumors in each group in c. Error bars represent±S.E.M. (b) Western immunoblot detection of DR5, DR4, p-c-jun and pERK in response to hvTRA and vemurafenib treatment (50 mg/kg every second day). Tumors were harvested on day 4, 2 h after the last treatment. H3 was used as loading control. (d) Western immunoblot detection of DR5 in response to hvTRA and vemurafenib treatment (50 mg/kg twice a day every 8th days). Tumors were harvested 8 days after the last treatment. α-tubulin was used as loading control. Each lane in b and d represents one individual tumor.

