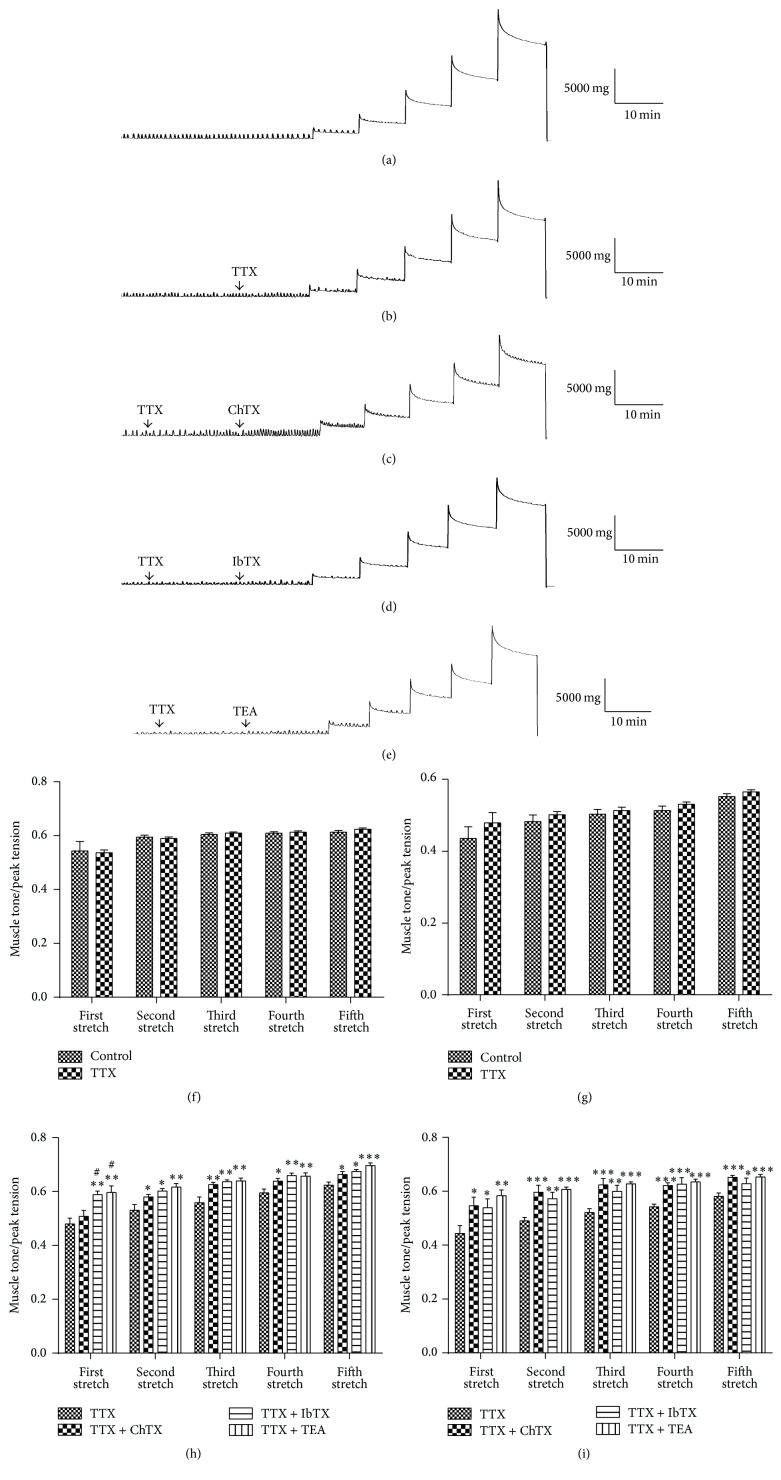
Figure 5.
The tension changes induced by stretch stimulations after blocking the nervous system by TTX. (a) The longitudinal muscle tension changes induced by stretch stimulation in the control group. (b) The longitudinal muscle tension changes induced by stretch stimulation in the TTX group. (c) The effects of TTX + ChTX on the longitudinal muscle tension changes induced by stretch. (d) The effects of TTX + IbTX on the longitudinal muscle tension changes induced by stretch. (e) The effects of TTX + TEA on the stretch-induced longitudinal muscle tension changes. (f) and (g) Statistical data of the ratio of stable muscle tone and stretched peak tension from TTX and control groups for longitudinal muscle (f) and circular muscle (g). (h) and (i) Statistical data of the ratio of stable muscle tone and stretched peak tension from TTX, TTX + ChTX, TTX + IbTX, and TTX + TEA groups for longitudinal muscle (h) and circular muscle (i). Values are shown as means ± SEM, n = 9 for TTX, TTX + ChTX, and TTX + TEA groups and n = 6 for TTX + IbTX group; ∗ P < 0.05, ∗∗ P < 0.01, and ∗∗∗ P < 0.001 versus TTX group; # P < 0.05 versus TTX + ChTX group.

