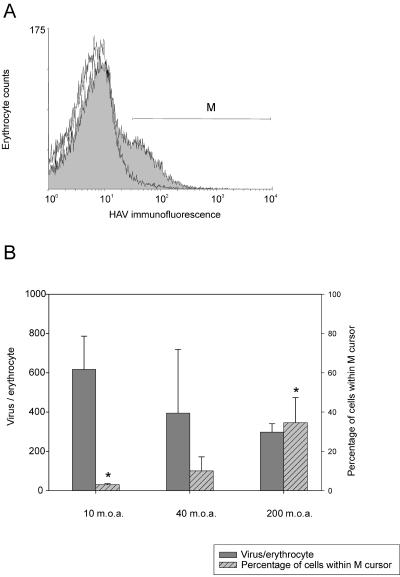
FIG. 2.
Immuno-flow cytometry detection of adsorbed HAV 150S particles on human erythrocytes. (A) Typical immunodetection experiment. Two curves are superimposed. The open curve on the left corresponds to erythrocytes in the absence of viruses but immunoassayed for HAV; the shaded curve on the right corresponds to erythrocytes with adsorbed viruses that were immunoassayed for HAV. Cursor M includes the subpopulation of erythrocytes with the highest fluorescence labeling. (B) The number of HAV receptors on the erythrocyte membrane and the percentage of erythrocytes with adsorbed HAV particles are plotted versus the viral inoculum added, or MOA. Asterisks indicate mean values that are significantly different (P < 0.05).

