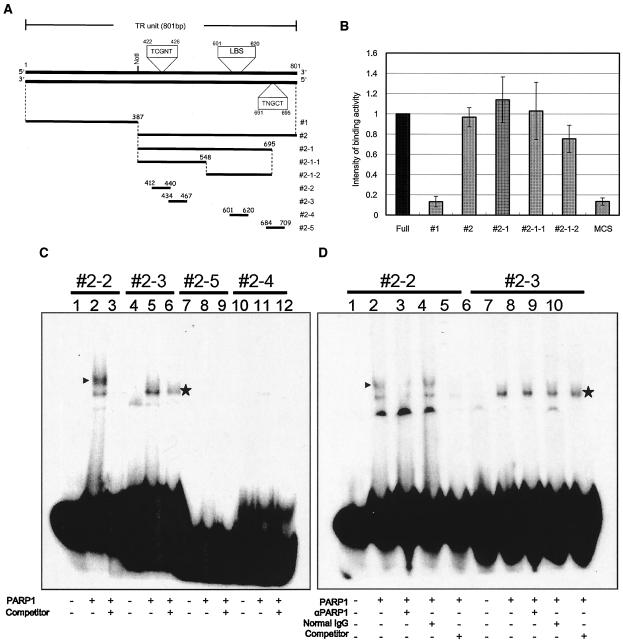
FIG. 4.
PARP1-binding assay. (A) Schematic representation of the TR fragments used for PARP1-binding experiments with ELISA and EMSA. Constructs 1, 2, 2-1, 2-1-1, and 2-1-2 were used in ELISAs, and constructs 2-2 to 2-5 were used in EMSAs. The position of the LANA-binding sequence (LBS) and the suspected PARP1-binding sequences (5′-TCGNT-3′) reported by Nirodi et al. (41) are also shown. (B) PARP1 binding by ELISA. The bound biotinylated fragment was detected colorimetrically by using a streptavidin-biotin-AP complex and pNpp as a substrate. The optical density at 405 nm was measured, and the arbitrary scale of binding intensity for each fragment is shown, where the intensity for the full-length TR was set at 1. (C) EMSA. Each fragment was fill-in labeled with Klenow fragment and [α-32P]dCTP. Lanes 1, 4, 7, and 10, probe only; lanes 2, 5, 8, and 11, probes were incubated with 100 ng of human PARP1 (Trevigen); lanes 3, 6, 9, and 12, each probe was incubated with 100 ng of human PARP1 and a 100-fold excess of each nonlabeled probe. Specifically shifted bands are indicated by arrowheads. (D) EMSA with specific antibodies against PARP1. In this analysis, constructs 2-2 and 2-3 were analyzed. Lanes 1 and 6, probes only; lanes 2 and 7, probes were incubated with 100 ng of human PARP1; lanes 3 and 8, probes were incubated with rabbit polyclonal anti-PARP1 (αPARP1) antibodies (2 μg) and 100 ng of human PARP1; lanes 4 and 9, probes were incubated with normal rabbit IgG (2 μg) and 100 ng of human PARP1; lanes 5 and 10, probes were incubated with 100 ng of human PARP1 and a 100-fold excess of nonlabeled probes. The band that specifically shifted and disappeared with the addition of antibody is indicated by an arrowhead. Asterisks denote nonspecific binding. +, present; −, absent.

