Figure 1.

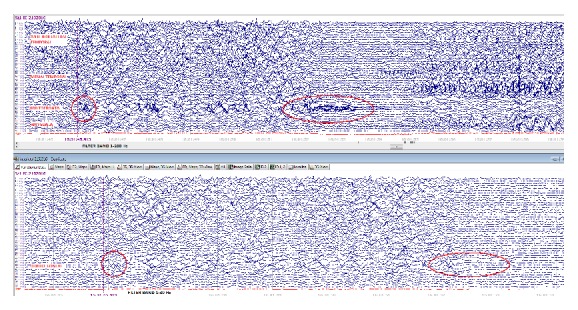
This synchronized ictal EEG on patient three at the onset of a typical seizure. The top EEG depicts interictal HFO evolving to ictal pattern. The bottom EEG only shows focal slowing at the onset but the ictal HFO is obscured by the filter.

This synchronized ictal EEG on patient three at the onset of a typical seizure. The top EEG depicts interictal HFO evolving to ictal pattern. The bottom EEG only shows focal slowing at the onset but the ictal HFO is obscured by the filter.