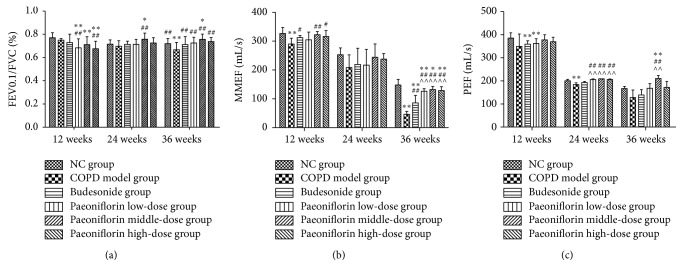
Figure 1.
Effects of PF on pulmonary function of rats of different stages. The histograms of FEV0.1/FVC% (a), PEF (b), and MMEF (c), respectively, indicated successful formation of COPD. Data were mean ± SEM (n = 8). ∗ P < 0.05, ∗∗ P < 0.01, compared with the Normal Control group. # P < 0.05, ## P < 0.01, compared with the COPD model group. ∧∧ P < 0.01, compared with Budesonide group.

