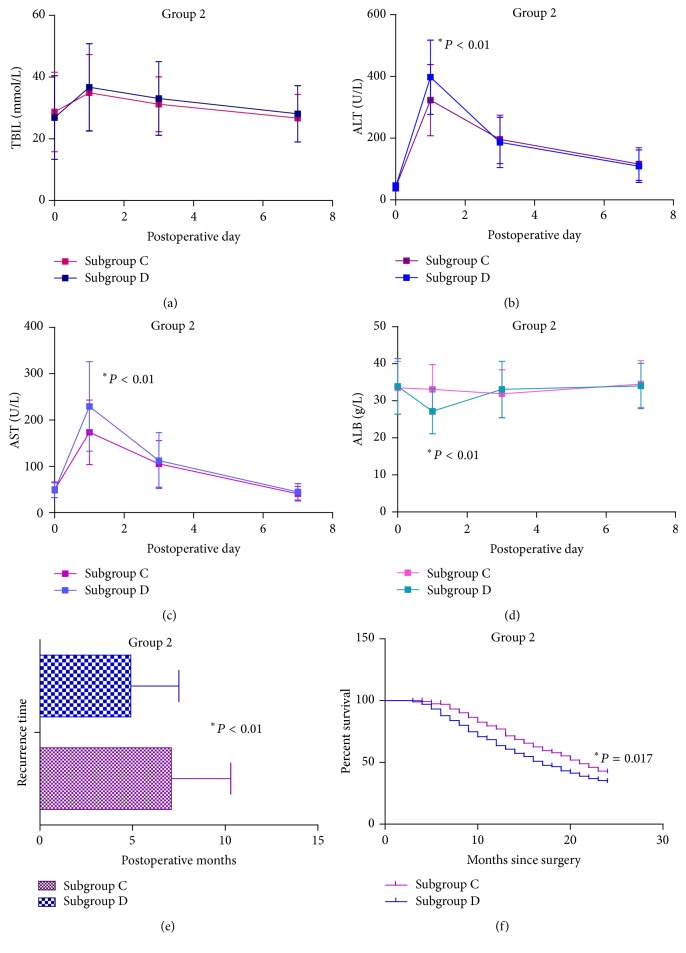
Figure 3.
Curves of parametric data for patients in group 2 during the perioperative period and prognosis data. (a) Curves of TBIL levels in group 2 on postoperative days 1, 3, and 7. (b) Curves of ALT levels in group 2 on postoperative days 1, 3, and 7. (c) Curves of AST levels in group 2 on postoperative days 1, 3, and 7. (d) Curves of ALB levels in group 2 on postoperative days 1, 3, and 7. (e) Recurrence time of patients in group 2. (f) Cumulative survival of all included patients in group 2 in the first 24 postoperative months.

