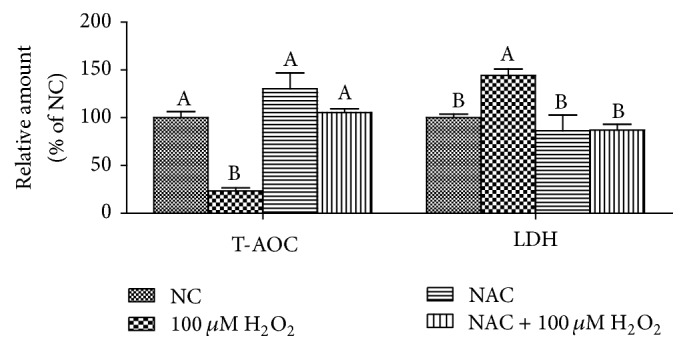
Figure 5.

The concentrations of T-AOC and LDH in the IPEC-J2 cells. Cells were treated with 0 (NC) or 800 μM NAC and 0 or 100 μM H2O2, respectively. Data were expressed as means ± SEM of at least three independent experiments. a–bValues with different letters are significantly different (P < 0.05).
