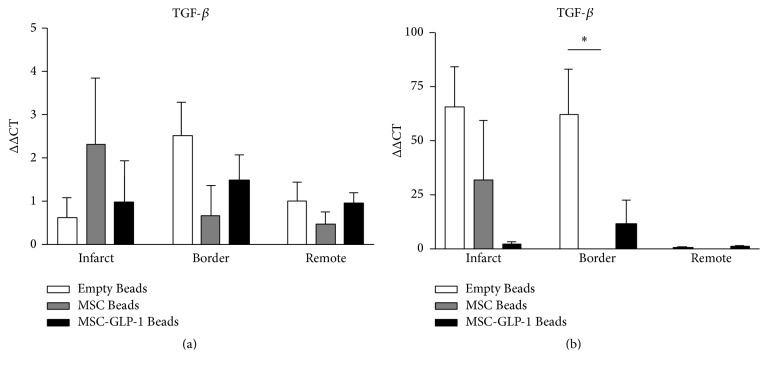
Figure 5.
Quantification of TGF-β mRNA levels using qRT-PCR. (a) One week after MI, all groups exhibited minor increases in mRNA levels across all regions. (b) Four weeks after infarction, large increases in TGF-β were found in the infarct of Beads and Beads-MSC groups. A significant increase was observed in the Empty Bead group in the border zone. N = 3–5 per group; P < 0.05.

