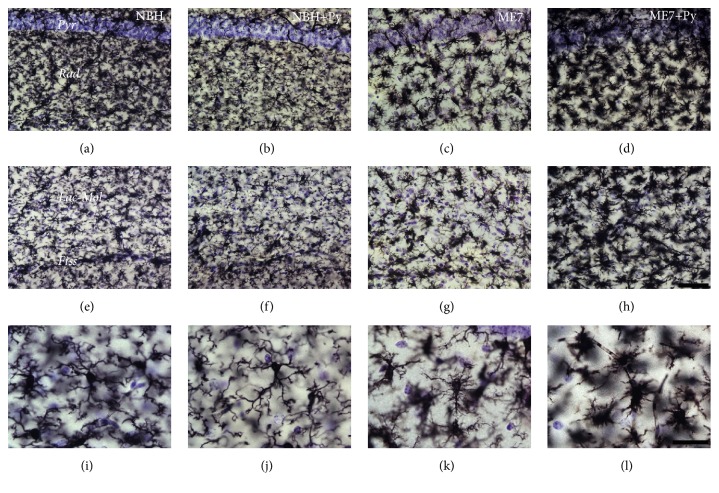
Figure 4.
Photomicrographs of CA1 microglial cells taken from sections of NBH (a, e, and i); NBH+Py (b, f, and j); ME7 (c, g, and k); ME7+Py (d, h, and l). From left to right the 1st, 2nd, 3rd, and 4th columns correspond, respectively, to subjects intracerebrally (i.c.) injected with normal brain homogenate, NBH, with NBH and nasal instilled with Piry virus suspension, NBH+Py, i.c., injected with ME7 infected brain homogenate, ME7, i.c., injected with ME7 and nasal instilled with Piry virus suspension, ME7+Py. First row corresponds to pyramidal cell layer (Pyr) and stratum radiatum (Rad). Second row corresponds to lacunosum molecular layer (Lac-Mol), hippocampal fissure (Fiss), and small portion of the molecular layer of dentate gyrus below hippocampal fissure. The third row corresponds to high power pictures to illustrate different stages of microglial morphological activation. Note that microglia from ME7+Py group is closer to the amoeboid format (last stage of morphological change of activated microglia). Scale bars (a)–(h) = 50 μm; (i)–(l) = 25 μm.

