Figure 5.

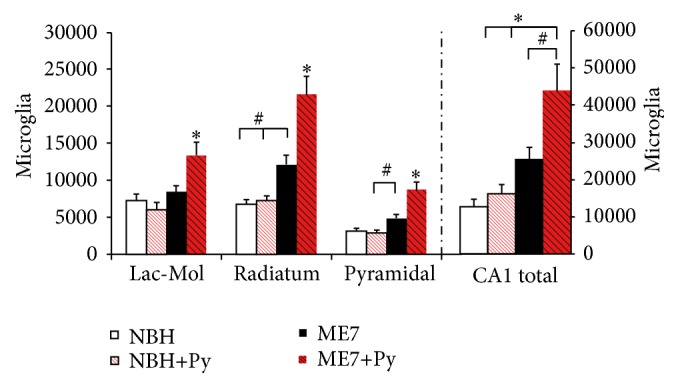
Stereological estimate of total microglia (CA1 total) and on CA1 lacunosum molecular (Lac-Mol) and radiatum and pyramidal layers. Note that as compared to all other groups, Piry (Py) virus infections in combination with intracerebral injection of ME7 infected brain homogenate (ME7+Py), significantly increased the number of microglia in all layers. Normal brain homogenate intracerebrally (i.c.) injection (NBH); NBH i.c. injection and virus suspension instilled intranasally (NBH+Py); ME7 infected brain homogenate (ME7). ∗ indicates significant differences between ME7+Py and all other groups and layers (one-way ANOVA, p < 0.01), and # indicates p < 0.05. Two-way ANOVA revealed that virus infection interacts with prion disease and exacerbates microglial response (p = 0.01).
