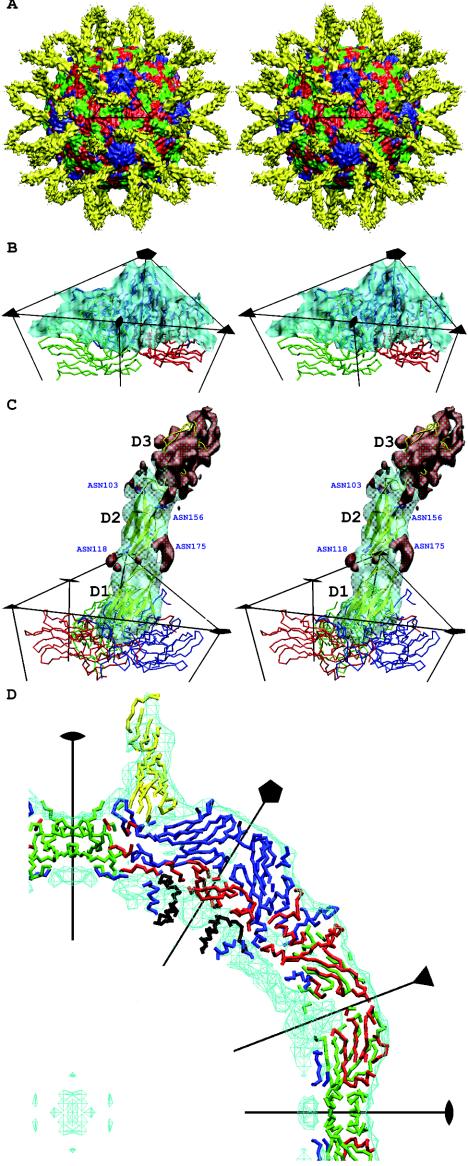
FIG. 1.
(A) Stereo view of the surface-shaded cryoEM map of HRV16 complexed with ICAM-1 (yellow) and showing VP1 (blue), VP2 (green), and VP3 (red). The black triangle shows the limit of one icosahedral asymmetric unit. (B) Stereo view showing the quality of fit of the HRV16 capsid structure into the cryoEM map surface. VP1 (blue), VP2 (green), and VP3 (red) are represented by a trace of their Cα atoms. The density corresponding to ICAM-1 has been removed. (C) Stereo view of one ICAM-1 molecule bound to HRV16. Oneicosahedral asymmetric unit is outlined in black, showing one copy of the difference density of the ICAM-1 molecule in transparent cyan. ICAM-1 is shown as a yellow ribbon. VP1 (blue), VP2 (green), and VP3 (red) are also shown. The four Asn residues that are N-linked to carbohydrates are drawn and labeled in blue. The densities that have not been fitted with the atomic models for the ICAM-1 domains D1 and D2 are shown in red, which include the densities of the carbohydrates moieties belonging to domain D2, as well as the density of domain D3. (D) The central slab (−10 to 10 Å in the Z axis) of the cryoEM density (cyan) fitted with the appropriate backbone structures of ICAM-1 (yellow), VP1 (blue), VP2 (green), VP3 (red), and VP4 (black).

