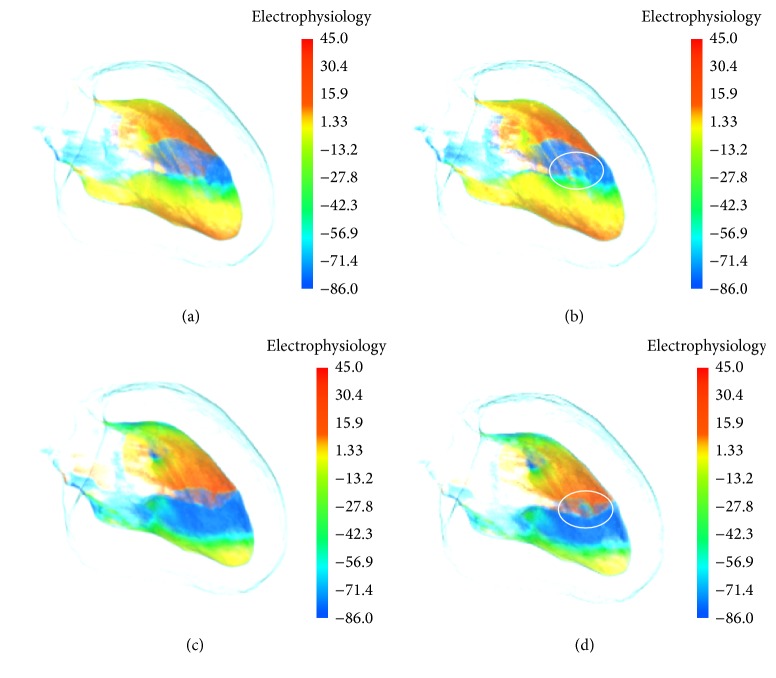
Figure 4.
Electrophysiology visualization of inner left ventricle at different time under the ischemia condition: (a) by conventional optic radiation model at 720 ms; (b) by the depth weighted optic attenuation model at 720 ms; (c) by conventional optic radiation model at 1040 ms; (d) by the depth weighted optic attenuation model at 1040 ms.

