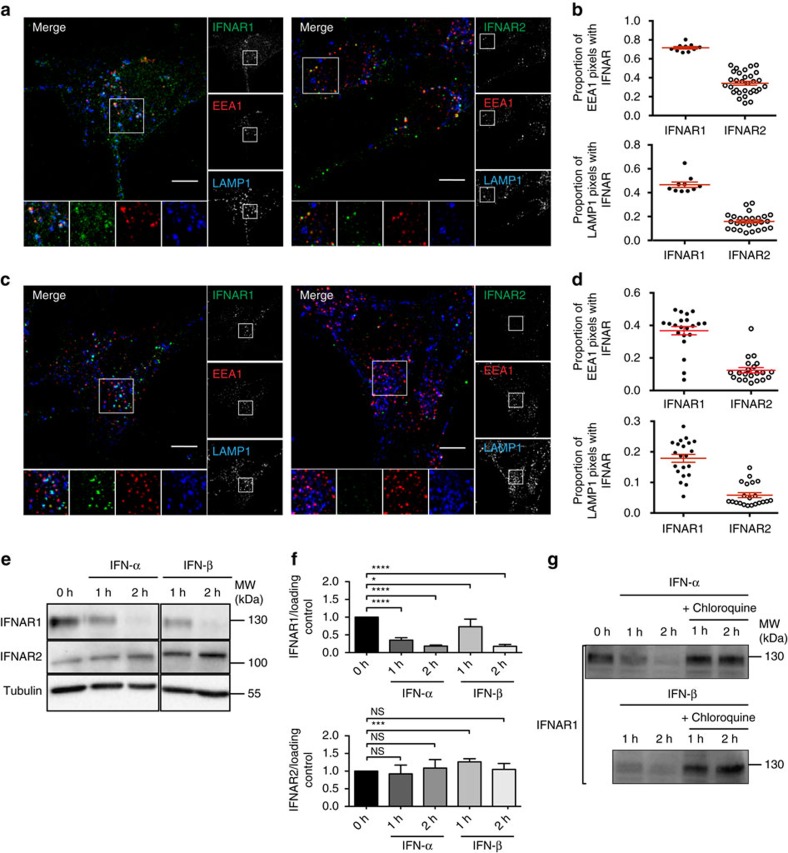
Figure 1. Intracellular localization of IFNAR1 and IFNAR2 subunits after IFNAR endocytosis.
(a) Immunofluorescent labelling of endocytosed IFNAR1 and IFNAR2 subunits on 20 min IFN-α stimulation in RPE1 cells. Following fixation, cells were co-labelled for EEA1 and LAMP1, and analysed by confocal microscopy. (b) Quantification of co-localization in a expressed as the Manders' coefficient, indicating the proportion of EEA1 pixels (upper panel) or LAMP1 pixels (lower panel) containing IFNAR1 and IFNAR2 pixels. (c) Immunofluorecent labelling of endocytosed IFNAR1 and IFNAR2 subunits on 60 min IFN-α stimulation. Following fixation, cells were co-labelled for EEA1 and LAMP1, and analysed by confocal microscopy. (d) Quantification of co-localization in c expressed as the Manders' coefficient, indicating the proportion of EEA1 pixels (upper panel) or LAMP1 pixels (lower panel) containing IFNAR1 and IFNAR2 pixels. (e) Immunonoblot analysis of total levels of IFNAR1 and IFNAR2 subunits in RPE1 cells on IFN stimulation. Cells were pretreated with cycloheximide and stimulated with IFN-α or IFN-β at 37 °C for the indicated times. (f) Quantification of experiments performed in e: IFNAR1 or IFNAR2 level was normalized to loading control level (tubulin or CHC, clathrin heavy chain) and the ratio IFNAR/loading control was calculated for each condition. (g) Immunoblot analysis of total IFNAR1 level in RPE1 cells on IFN stimulation. Cells were pretreated with cycloheximide and chloroquine, followed by IFN-α or IFN-β at 37 °C for the indicated times. Scale bars, 10 μm. Reproducibility of experiments: (a,b) (upper panel: n=10 and 30 cells, respectively, and lower panel: n=10 and 26 cells, respectively, for each condition) and c,d (n=21 cells per condition) show representative data of three independent experiments; e shows representative data and f shows quantification of IFNAR1 of n=8, n=4, n=8, n=3, n=6 independent experiments, respectively, for each time point, and of IFNAR2 of n=8, n=4, n=6, n=3, n=4 independent experiments, respectively. Statistical analysis with Mann–Whitney test was performed. *P<0.05, ***P<0.001 and ****P<0.0001; NS, nonsignificant. g shows representative data for three independent experiments. Graphs b,d and f show mean value±s.e.m.

