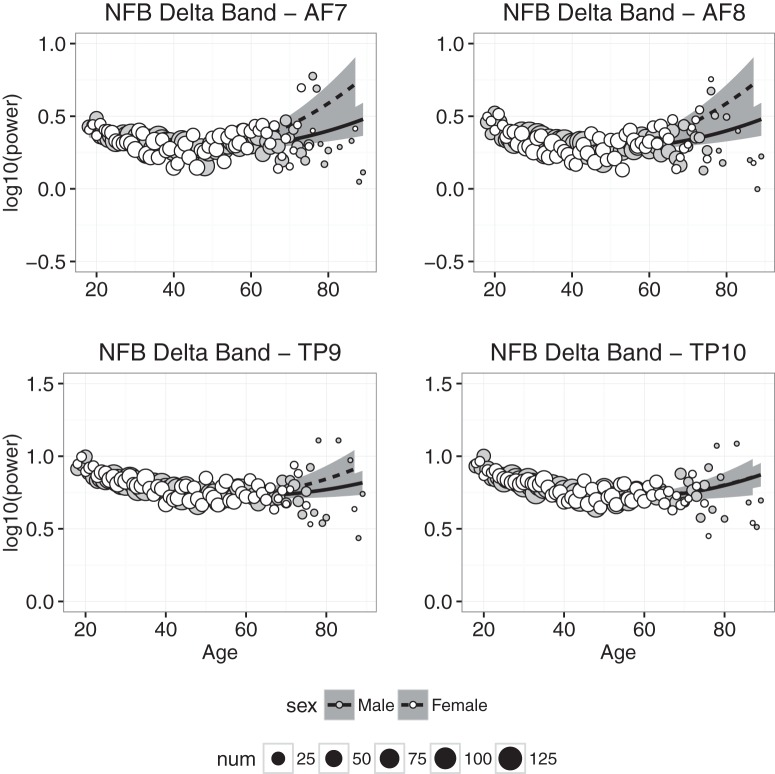
Figure 4.
Delta band power plotted against age for males (gray symbols) and females (white symbols). Each point represents the mean for that age; symbol size represents how many individuals were used to compute the mean. Regression was used to compute the best-fitting curves separately for males (solid line) and females (dashed line), and the shaded regions represent 95% confidence intervals.

